User Guide
1 Introduction to Xmon
2 Configuration of Xmon
2.1How to access Xmon?
2.2How to change my password?
2.3Pricing
2.4How to Configure a Data Contract?
2.5How to Configure a Data Source?
2.6How to Configure a Data Connector?
2.7How to define a Mail Group?
2.8How to Configure a Rule?
2.9 How to view available Users & Rights?
2.10 How to configure END USERS for RT Data Contract?
2.11 How to view and edit list of exchanges
2.12 How to view the FX table
2.13 How to Configure Fixed Cost
2.14 How to define a Factor Matrix
2.15 Tag requests
2.16 How to Define a Bulk Data Set
2.17 Permissions
3 Reports and Analysis
3.1Real-Time Dashboard
3.1.1Quotas, Rules and Modifiers
3.1.2‘Month-To-Date’ Widgets
3.1.3‘Monthly Subscriptions’ widget
3.1.4‘Requests’ Dashboard
3.2Understand the Request Status and workflow
3.3Reporting and Analysis Capabilities
3.3.1Daily Cost Reporting
3.3.2Daily Volume Reporting
3.3.3Review the Response Time of a Data Provider
3.4Cost & Usage Explorer Report
3.5Download Standard Reports
3.5.1Request Level Analysis Reports:
[STD-01] – Monthly Report by Source
[STD-03] – Requests by Date
[STD-06] – Monthly Invoice
[STD-07] – Monthly by System
[STD-09] – Monthly by contract
[STD-12] – Detailed fair cost allocation
[STD-13] – Detailed securities and fields
[STD-17] – Compare Historical Category Subscription
[STD-23] – BVal Monthly Invoice
[STD-32] – Average Daily Usage by System
[STD-32] – Average Daily Usage by System
3.5.2Simulation & Cost Optimisation Reports:
[STD-14] – Data usage analysis
[STD-18] – Scheduled Mode Cost Estimate
[STD-24] – Securities Discontinued From Download
[STD-29] – Benchmark Report
3.5.3Technical Reports:
[STD-02] – Rejected Requests
[STD-05] – Monthly Error
[STD-16] – Unknown Securities
[STD-33] – Request Files Export
3.5.4RT Entitlements Reports:
3.5.5Itemised Invoice (Verification Files) Reports:
3.6RT Exchange Subscription Cost – Report by End User
3.7RT Exchange Subscription Cost – Detailed Report
3.8Request Files Reconciliation
3.9Invoice Reconciliation Report
3.10 Cost Optimisation
3.11 Data Usage Summary
3.7.1Request Analysis
3.7.2Repeat Costs
3.7.3Multi Hit Analysis
3.7.4Cost Per Field
3.7.5Linked Categories
3.7.6Not Downloadable
3.7.7Pricing Model Optimization
3.12 Bulk Data Analysis
4 Data Operations
4.1Search
4.2Security Level Reconciliation
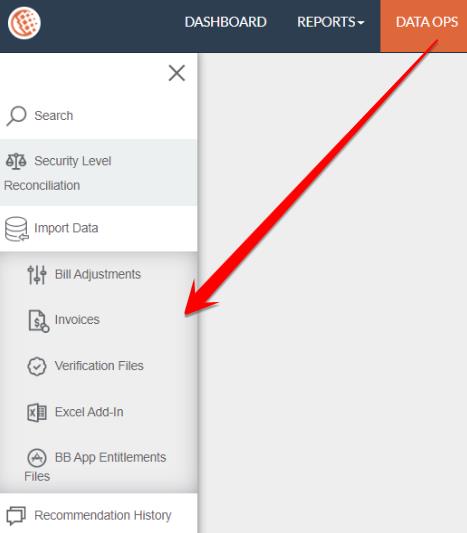
4.3Import Data
4.3.1How to define Bill Adjustment
4.3.2How to upload the Bloomberg Invoice
4.3.3How to upload Detailed Itemised Invoice
4.3.4How to upload Excel Add-In
4.3.5How to Simulate a Request
4.3.6How to upload Real-Time BB Entitlements Files for Application
4.3.7How to Upload Custom Fields
4.3.8How to configure Auto-tagging of requests
4.4Data Maintenance
4.5Recommendation History
5 Admin
1 Introduction to Xmon
1.1What is Xmon?
Xmon is TRG Screen's reference data monitoring and cost optimisation platform. It acts as a "smart meter" for your market data, providing real-time visibility into every data request across your organisation. By monitoring consumption patterns between your applications and data vendors, Xmon delivers transparency, identifies cost-saving opportunities, and ensures compliance—all while maintaining data quality and availability.
Key Features
- Real-Time Monitoring: Track all reference data requests as they happen, with complete visibility of fields, securities, and costs.
- Cost Transparency: See the true cost of every data request with detailed breakdowns by category, asset class, and requesting system.
- Cost Optimisation: Identify savings opportunities through multi-hit analysis, field-level cost assessment, and commercial model optimisation.
- Invoice Reconciliation: Prevent billing errors by independently verifying vendor charges against actual usage.
- Comprehensive Reporting: Access standard and custom reports for usage patterns, cost allocation, and optimisation opportunities.
- Rules Engine: Create and enforce policies to control data usage, preventing costly mistakes and ensuring compliance.
- Xmon Insights Service: Receive expert analysis and recommendations from our team of reference data specialists.
1.2How does it work?
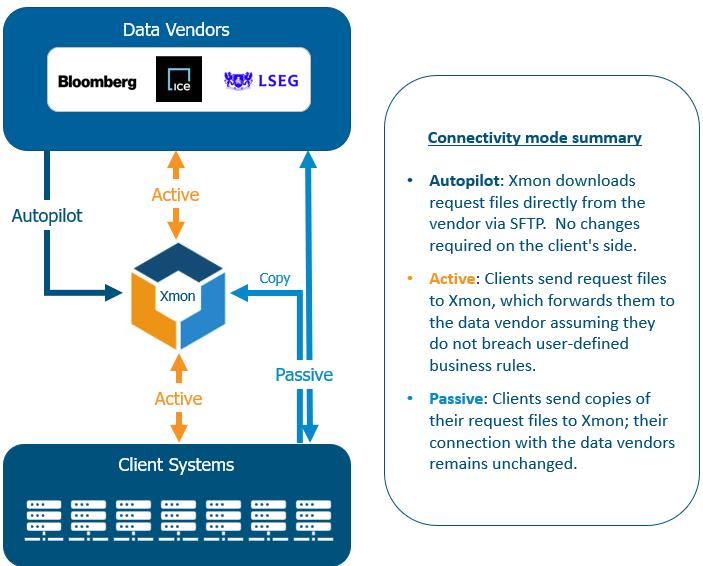
Xmon is a secure, high-performance cloud-based solution that requires no client-side installation. It operates by positioning itself strategically alongside or between your internal systems and market data providers to monitor all data requests and can apply intelligent controls in real-time. There are three ways of connecting with Xmon; Autopilot, Active and Passive. Each mode is described below.
Key Components:
There are several key components which connect the client, vendor and Xmon.
- Data Contract: represents the contract you have signed with a Data Vendor. Clients usually have one dedicated contract per division.
- Pricing: represents the vendor commercial model (Per Security, Band and Bval) for a given data license account.
- Data Licence Account: You may have one or multiple Data Licence accounts within one contract. By 'optimising’ DL accounts, Bloomberg, nets requests together. This can lead to cost optimisation by lowering ‘First request’ costs.
- Data Source: The connection channel from Xmon to the data vendor e.g. Bloomberg, ICE, LSEG etc. A data source connects to one DL account.
- Data Connector: Represents your systems/consuming applications sending requests to the vendor (or to Xmon in active mode). A single Data Source may have multiple Data Connectors associated with it; however, each Data Connector must be linked exclusively to one Data Source.

2 Configuration of Xmon
2.1How to access Xmon?
To access the Xmon web console:
1. Navigate to xmon.xpansionfts.com in your browser,
2. Enter your username and password and click "Login"
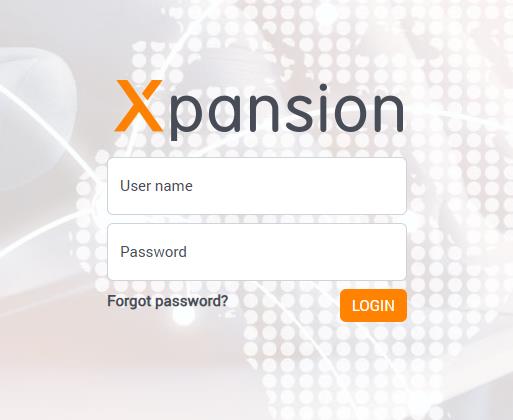
Xmon web console is supported by the main browsers, such as Chrome and Internet Explorer.
Note: All user accounts are managed by TRG Screen. If you have not received login credentials, please contact our support team at xmonsupport@xpansionfts.com.
2.2How to change my password?
The first time you login to Xmon with the login/password provided by Xmon Support team, you will be asked to change your password automatically.
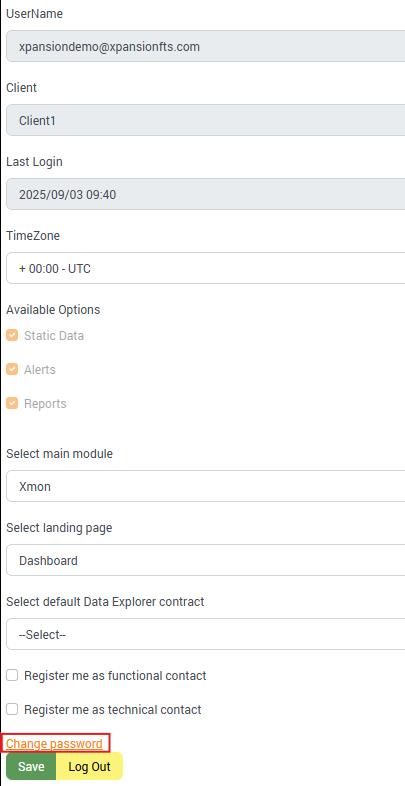
You can change your password anytime by:
1. Clicking on your name in the top-right menu bar,
2. Selecting "Change password".
For SSO Users:
If your organisation uses Single Sign-On (SSO), password management is handled through your corporate identity system. The "Change password" option will not be available in your Xmon profile when SSO is enabled. Contact your IT administrator to change your SSO credentials.
2.3Pricing
Note: Pricing Matrices will be configured by the Xmon team as part of your onboarding process. Contact Xmon Support if your rate card has changed.
Pricing matrices are created by the Xmon Support team and reflect current vendor rate cards.
Xmon's pricing functionality allows you to view and understand the cost calculations used for your reference data requests. The system supports two main pricing models that reflect how vendors like Bloomberg structure their charges, Pay As You Go and Band pricing.
To view pricing details, navigate to SETTINGS > PRICING from the main menu. This section displays the pricing matrix associated with each contract.
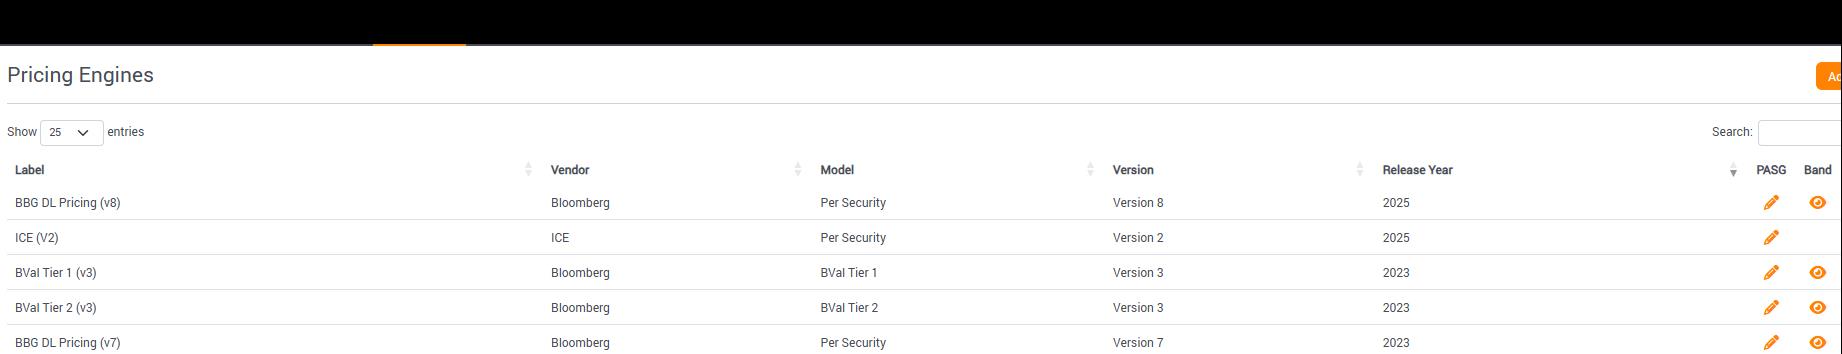
Click the pencil icon next to any pricing model to view detailed pricing information.
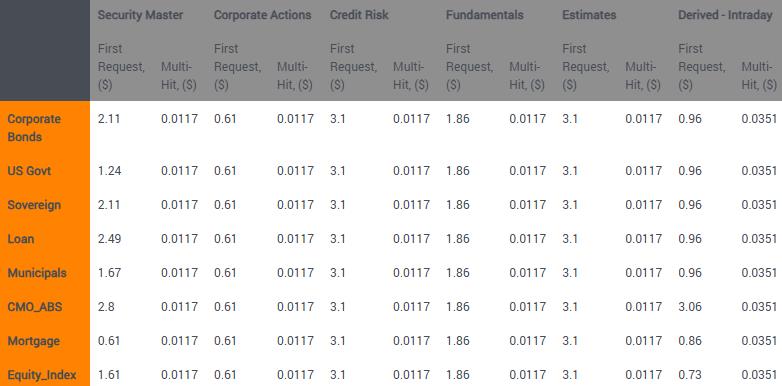
Pay As You Go
This model charges based on individual requests and includes:
- First Request Cost: Corresponds to Bloomberg's "Unique fee" - the initial charge when requesting a security/category combination for the first time in a month.
- Multi-Hit Cost: Corresponds to Bloomberg's "Access fee" - lower charges for repeat requests of the same security/category within the same month.
The pricing matrix will display with:
- Categories listed horizontally (e.g., Security Master, Pricing, History)
- Asset types listed vertically (e.g., Equities, Fixed Income, Derivatives)
- Cost values at the intersection of each category and asset type
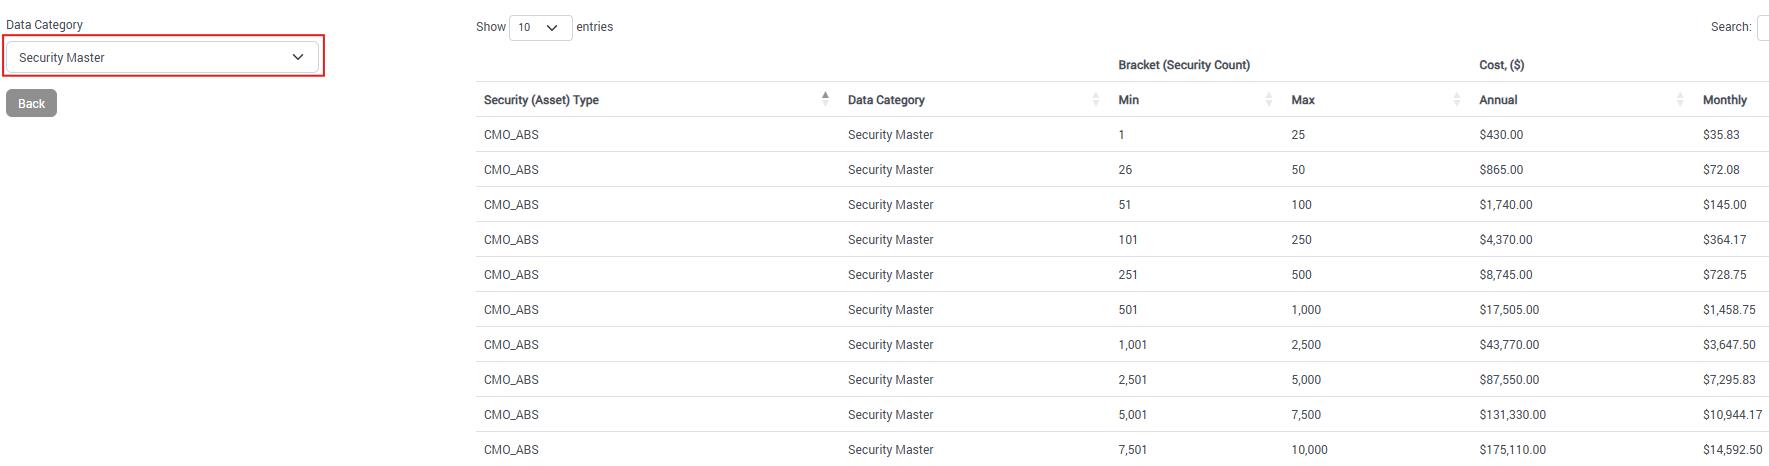
Band Pricing
This model groups securities into volume-based pricing tiers, where costs are determined by the total number of unique securities requested over a rolling 4-month period.
Select a Data Category from the drop-down list, at which point the pricing matrix will display with:
- Asset types listed vertically (e.g., Equities, Fixed Income, Derivatives)
- The Security count range per bracket
- The monthly and annual cost.
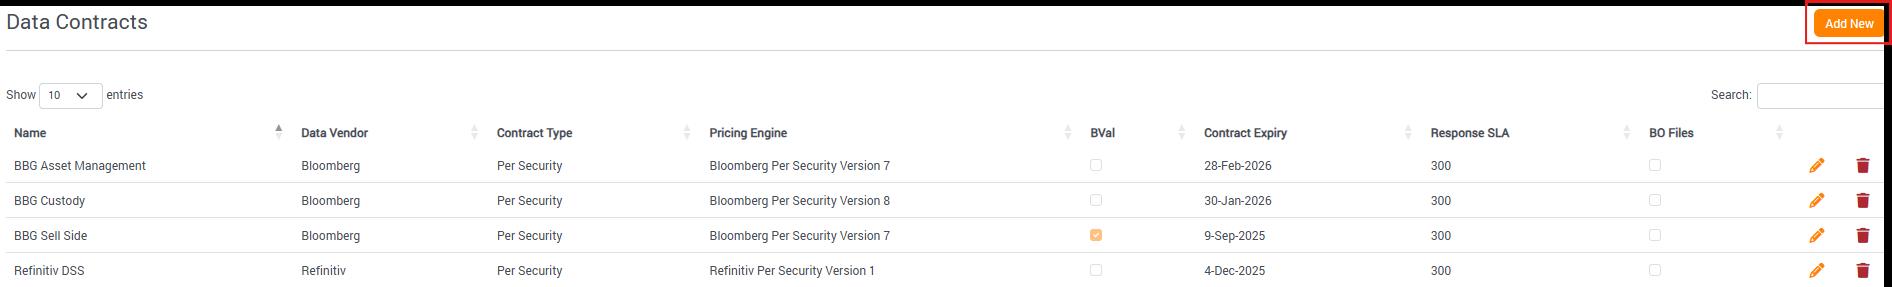
2.4How to Configure a Data Contract?
Note: Data Contracts will be configured as part of your Xmon onboarding process by the Xmon team. To add additional Data Contracts, follow the steps below or contact Xmon Support.
A Data Contract in Xmon represents the commercial agreement you have with a data provider (such as Bloomberg or Refinitiv). This configuration is essential because it defines how Xmon calculates costs, applies pricing models, and manages your vendor relationship within the system.
Every Data Source must be linked to a Data Contract to ensure accurate cost calculations and proper system functionality.
To set up a new Data Contract:
- Navigate to Settings > Data Contracts from the main menu
- Click the Add New button
- Complete the required fields as described below
- Click the Save button to save your configuration
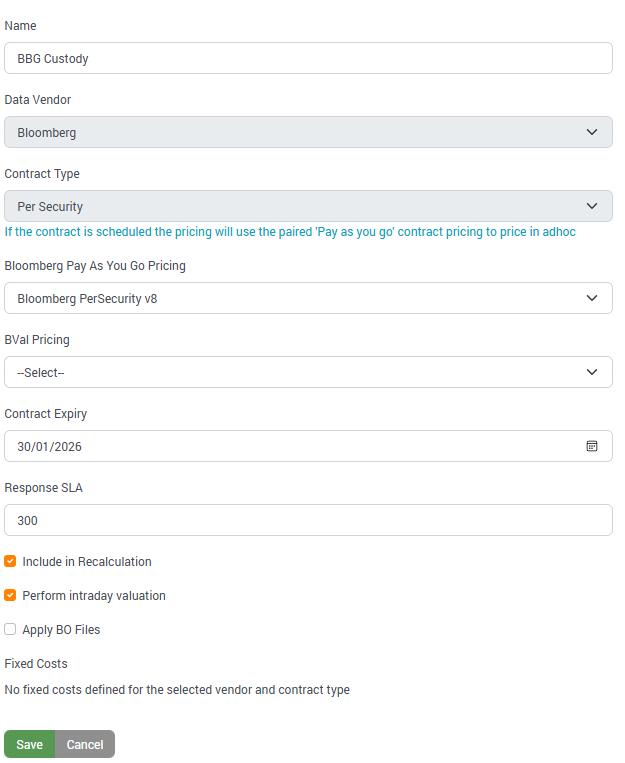
Field Descriptions:
- Contract Name: Enter a descriptive name that identifies this contract e.g. "Bloomberg Sell Side" or "LSEG DSS". This name will appear throughout Xmon when selecting contracts.
- Contract vendor: Choose from the drop-down list of supported data vendors.
- Contract Type: Select Per Security for Reference Data requests.
- Pay As You Go Pricing: Select the pricing model that matches your vendor agreement.
- Contract Expiry: Add the expiry of the contract.
- Response SLA: Add the maximum delay (in seconds) to response to each request from the data provider as per the Service Level Agreement negotiated in the contract – use ‘300’ as a default.
2.5How to Configure a Data Source?
Note: Data Sources will be configured as part of your Xmon onboarding process by the Xmon team. To add additional Data Sources, follow the steps below or contact Xmon Support.
Each ‘Data Source’ in Xmon represents a data provider account e.g. Data Licence account.
To set up a new Data Source:
1.Navigate to Settings > Sources from the main menu,
2.Click the Add New button,
3.Complete the required fields as described below,
4.Click the Save button to save your configuration.
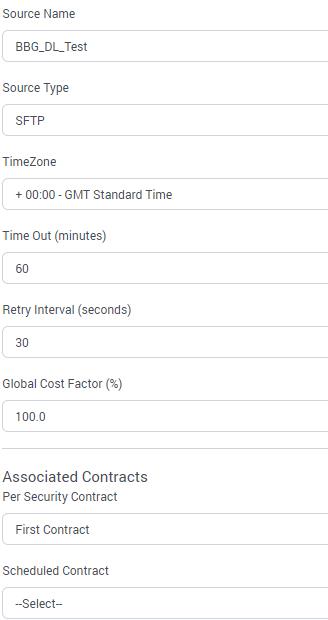
Field Descriptions:
- Source Name: The name of the Data Source in Xmon, which will be used in all reports.
- Source Type: Select connection type from dropdown (Secure FTP, Secure FTP + KEY, Web API, Open API, HAPI).
- Timezone: Select ‘+ 00:00 – UTC’
- Time Out: Minutes before pending requests are cancelled and marked "Time Out". Enter ‘60’ as the default value.
- Retry Interval: Seconds to wait between retry attempts. Enter ‘30’ as the default value.
- Global Cost Factor: Apply global cost adjustments for premium rates or redistribution costs.
- Associated Contracts / Per Security Contract: Links to your data provider contract and associated Pricing Matrix (Rate Card).
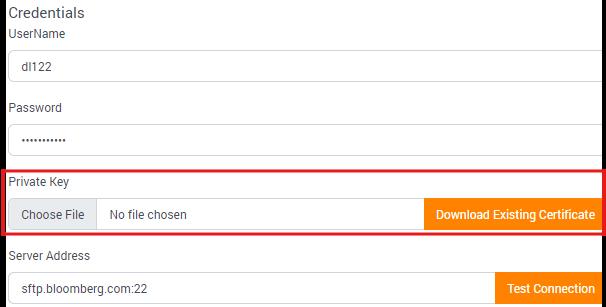
Each source type (SFTP, WebAPI, HAPI) requires different credentials mirroring the credentials for the vendor.
SFTP/SFTP+Key:
- Username: Your data provider account username (e.g. dl01234)
- Password: Your data provider account password (case sensitive)
- Private Key: SFTP+Key only – Your data provider Private Key. Upload by clicking on the ‘Choose File’ button and selecting the file from your local drive - password not required.
- Server Address: Your data provider's server address e.g. sftp.bloomberg.com:22
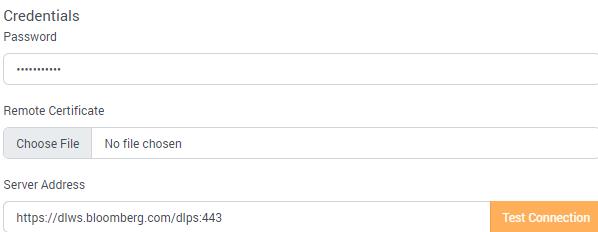
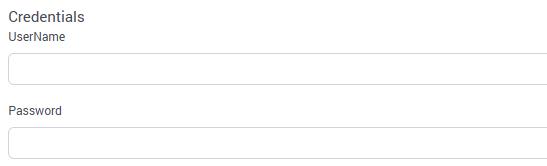
WebAPI:
- Password: Your data provider account password (case sensitive)
- Vendor Remote Certificate: Your data provider Remote Certificate. Upload by clicking on the ‘Choose File’ button and selecting the file from your local drive.
- Server Address: Your data provider's server address e.g. https://dlws.bloomberg.com/dlps:443
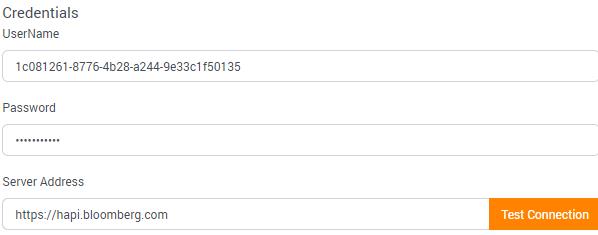
HAPI:
- Username: Your data provider Client ID
- Password: Your data provider Client Secret Key
- Server Address: Your data provider's server address e.g. hapi.bloomberg.com or api.bloomberg.com
To edit or delete an existing Data Source, click the pencil or bin icons respectively.
2.6How to Configure a Data Connector?
A Data Connector in Xmon represents each internal system or application that requests reference data from vendors. Since systems can have multiple ways of connecting to data providers (different APIs, protocols, or connection methods), each connection channel requires its own connector configuration.
To set up a new Data Connector:
1. Navigate to Settings > Data Connectors from the main menu,
2. Click the Add New button,
3. Complete the required fields as described below,
4. Click the Save button to save your configuration.
Field Descriptions:
- System Name: The name of the System making market data requests, which will be used in reporting. Note: the system name should not contain any spaces – use underscores instead e.g. “Risk_Engine”
- System Group: Create logical groupings of related systems e.g. "Trading", "Risk", "Operations", "Research” etc.
- Connector Name: Provide a unique identifier for this specific connection describing the connection method or purpose e.g. "Portfolio_Mgmt_SFTP", "Risk_Engine_WebAPI".
- Environment: Select the appropriate environment type: PROD for Production environment and NON-PROD for non-production environment.
- Source Type: Secure FTP, Secure FTP + KEY, WebAPI, Open API, HAPI.
- Purpose: Select the integration mode that defines how Xmon monitors this connector: Active, Backdated (Passive), Autopilot (Xmon), Autopilot (Agent), Simulation. Refer to section 1.2 How does it work? For additional information.
- Data Source: Select which vendor account (Data Source) this connector relates to. It must correspond to an existing Data Source.
- Authentication credentials vary depending on the Source Type selected:
- SFTP:
▪Username: Create a unique username for this connector's Xmon login. This is what your system will use to authenticate with Xmon. It should be descriptive and follow the naming convention e.g. "orgname_DLnumber_system_environment"
▪Password: Set a secure password for the connector. Your system will use this password to connect to Xmon.
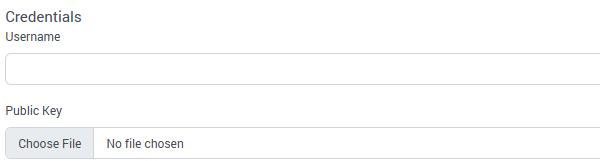
- SFTP+Key:
▪Username: Create a unique username for this connector's Xmon login. This is what your system will use to authenticate with Xmon. It should be descriptive and follow the naming convention e.g. "orgname_DLnumber_system_environment"
▪Public Key: Create a Private and Public key pairing and upload the Public Key into the Data Connector.
- WebAPI:
▪Certificate & Password: The Xmon Team will create and upload the Remote Cert and password into the Data Connector. The password should not be changed. You can download certificate from the Data Connector once created, and upload to your application.
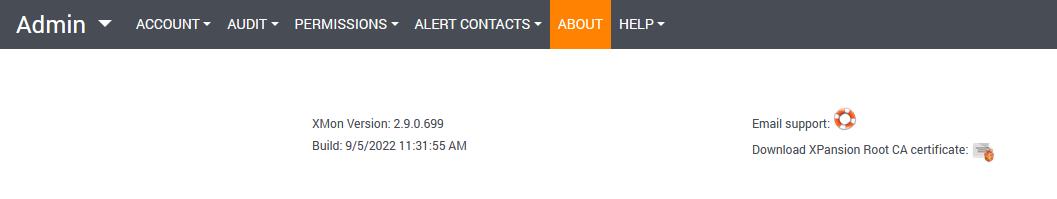
▪Root CA: You must also download the Root CA from the ‘About’ Section in Xmon and trust it on your local machine.

- HAPI:
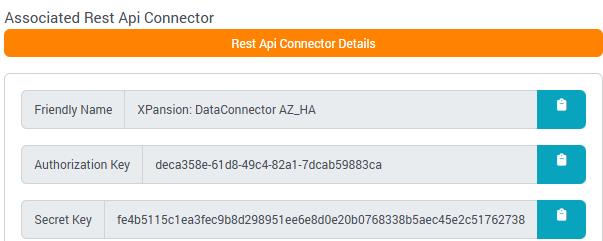
•Authorisation Key and Secret Key: The ‘Create Rest API Connector’ box below is automatically selected. When the Data Connector is saved, the credentials are created.
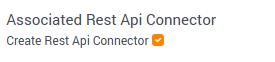
•Edit the Data Connector and select ‘Rest Api Connector Details’ to view the newly created credentials.
To Edit or Delete an existing Connector, simply click respectively on the pencil or bin icons.
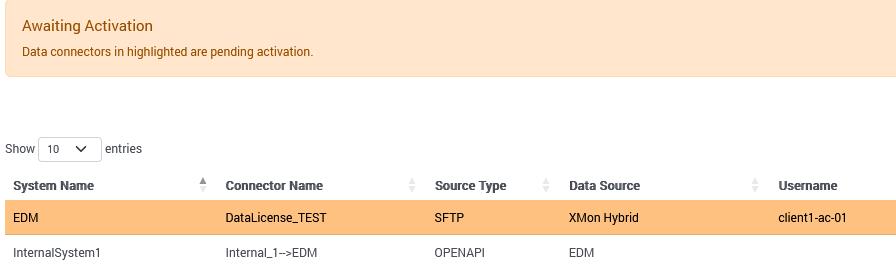
When a new Connector has been added, it will be highlighted in Orange and a message “Awaiting Activation” will be displayed in the Orange Banner until it has been activated by Xmon support team.
Note: If you use Data Access Permissions to restrict user access to certain data connectors, you will have to add the new connector to the appropriate permission groups. This ensures users can see data from this connector in reports etc. See section 2.18.1 Data Access for additional information.
2.7How to define a Mail Group?
Mail Groups in Xmon are collections of users who should receive notifications when specific alerts or rules are triggered. Instead of manually entering individual email addresses each time you create a rule, you can create reusable mail groups that organize recipients by role, department, or responsibility.
Mail Groups streamline notification management and ensure the right people are alerted when important events occur in your reference data environment.
You can access Mail Group configuration through either:
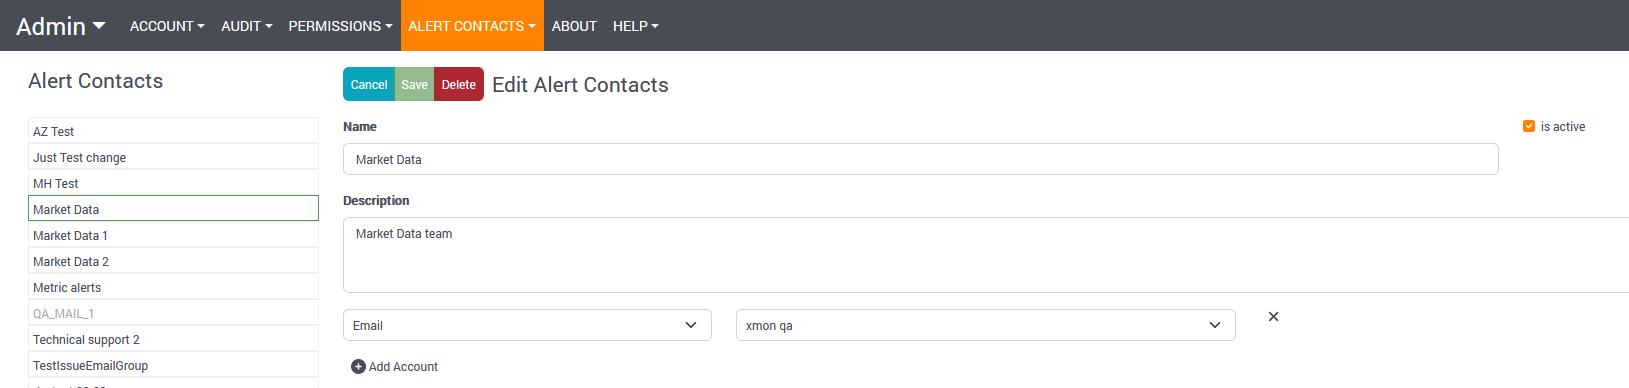
- Admin: Click Xmon in the top-left ribbon, select Admin and navigate to Alert Contacts > Definitions
- User Profile: Click on your username in the top-right corner and navigate to Alert Contacts > Definitions
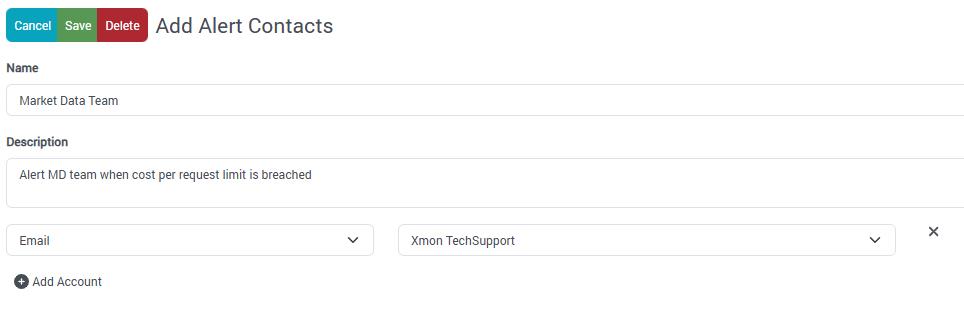
To set up a new Mail Group:
1.Click the Create new Alert Contact button
2.Complete the required fields as described below
3.Add users to the group
4.Click the Save button to save your configuration
Field descriptions:
●Name: Enter a descriptive name for the mail group e.g. "Finance_Team_Cost_Alerts", "IT_System_Administrators", "Compliance_Officers" etc
●Description: Provide a detailed explanation of the group's purpose
Add User Process:
●Click the Add Account button
●Select users from the dropdown list of available Xmon users
●Repeat to add multiple users to the same group
●Users can be members of multiple mail groups as needed
Removing Users:
●Click the X button next to any user you want to remove from the group
2.8How to Configure a Rule?
Xmon tracks reference data requests and can validate them against a defined set of cost and/or volume-based rules. Xmon’s powerful rules engine applies controls at the user level, organisation level and levels in-between, and allows proactive data access management to be implemented. Using Active mode, data analytics are computed in real-time and evaluated against access and quota rules to determine whether or not a request should authorised. Each market data request can be validated against one or multiple rules before being sent to the data provider.
There is a range of multiple conditions you can set within a rule. Each rule needs to contain one condition on either Data Contract, Data Source, Data System or Data Connector. Below is a list and description of the conditions:
- Cost: Helps you set cost limit per request/day/month to avoid large cost spikes.
- Volume: Helps you set security count limits per request/day/month.
- Request Type: You can filter requests sent in Ad-hoc pricing with quick data return, as opposed to Scheduled pricing. You can select between Adhoc, One-shot (Scheduled), Daily, Weekly and Monthly.
- Data System: Enables you to filter or apply the rules on one or more system names.
- Data Source: Enables you to filter or apply the rules on one or more data sources.
- Data Connector: Enables you to filter or apply the rules on one or more data connectors.
- Data Contract: Enables you to filter or apply the rules on one or more data contracts.
- Specific days and times: Select the time and date range to monitor specific requests with conditions Days Applied, Start Time Applied and End Time Applied.
- Data Type: Filter on particular data category.
- Field List: Enables you to filter requests on one or more specific fields.
- Security ID: Create a rule based on Security ID.
- Instrument Type: Enables you to filter or apply the rules on one or more instrument types.
- New Category: Enables you to be alerted on a category not requested in the previous month.
- Response ID: Enables you to filter requests for a specific response ID.
- Source Contributor: Is used to alert you of requests using a specified pricing source/contributor.
- Tag Filter: Enables you to filter on requests with a particular Tag value.
You can configure one of the following Actions: Block (only for Active monitoring of requests), Warn or Require Manual Approve.
NB When using Rule Frequency = ‘Per day’ or ‘Per month’, a quota will be computed and displayed on the Dashboard to see the aggregated value of the selected indicator for the current period.
2.8.1Creation
To define a new rule, go to the menu SETTINGS > RULES and click on the Add New button, input the required information and click Save when finished.
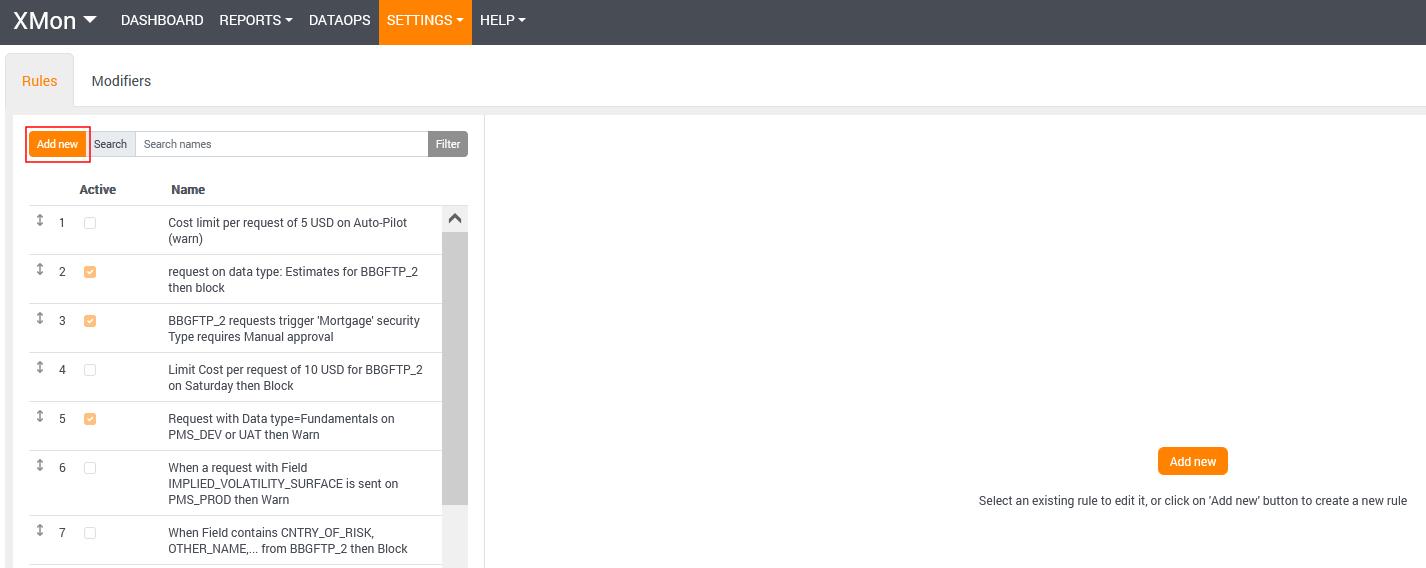
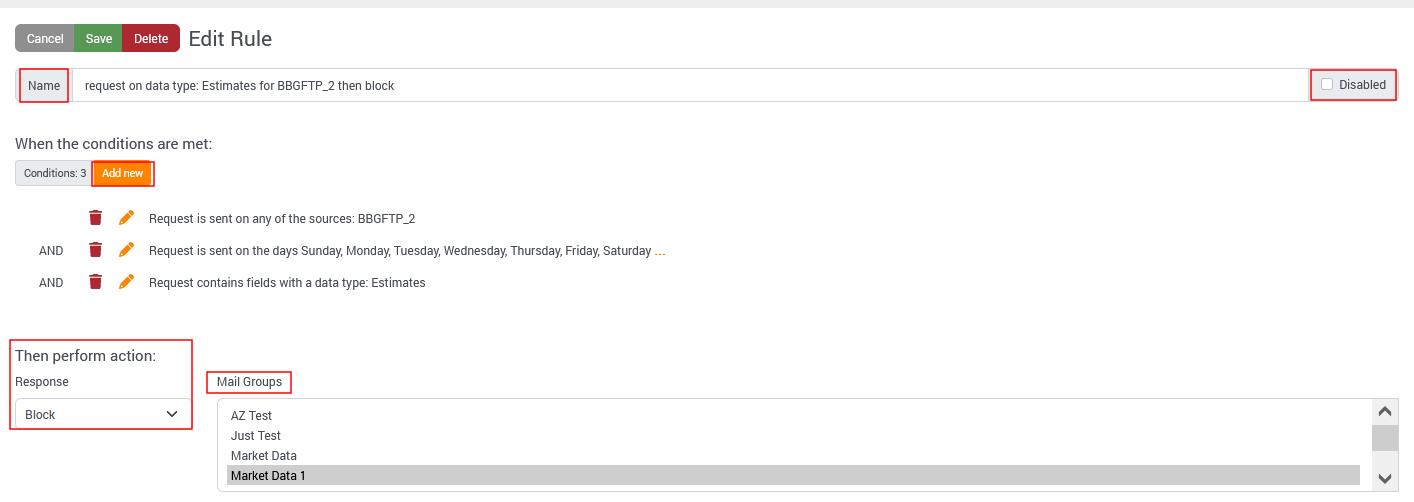
- Name: Input the description of the rule based on conditions and actions required.
- Condition:
- Choose between the conditions. Each rule needs to contain at least one of the following: Data Source, Data Connector, Data System or Data Contract.
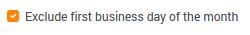
- Exclude first business day of the month: Tick this box if you want the Volume or Cost limit to be ignored during the first business day. This is to avoid warnings for expected cost spikes during the first requests in the month.
- Action:
- Response: Choose between ‘Block’, ‘Warn’ or ‘Require Manual Approve’.
- Recipients: Set up a list of email addresses (Mail group) - of the recipients when the rule is breached. Refer to section 3.17 How to define a Mail Group to find out how to set up a new Mail group. NB recipients must be Xmon users.
- Disable rule: Tick this to deactivate the rule. The rule will still appear in the list for future reference or reactivation.
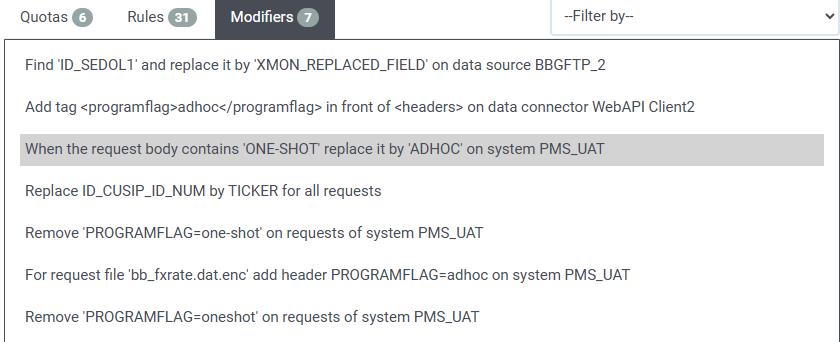
Modifiers:
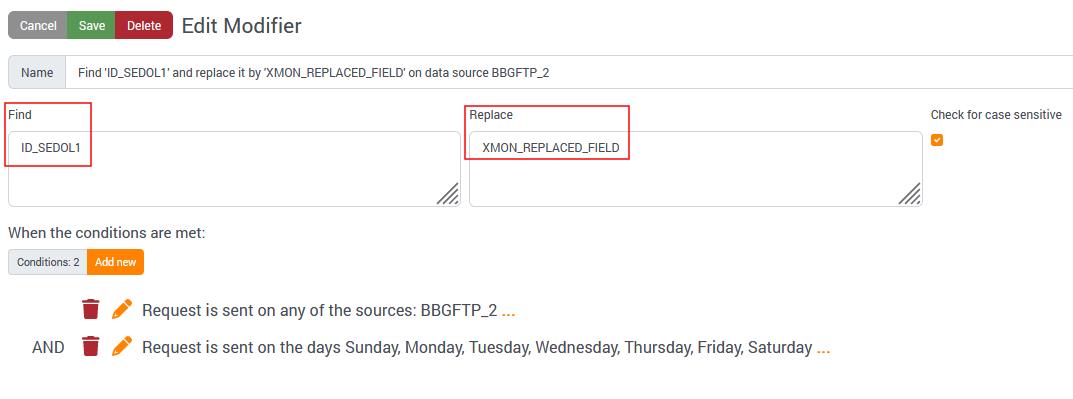
Another Rule type is ‘Modifiers’, which updates the request before being forwarded to the vendor by finding an input text and replacing it with an alternative one. To add a new Modifier, go to ‘Modifiers’ tab next to ‘Rules’.
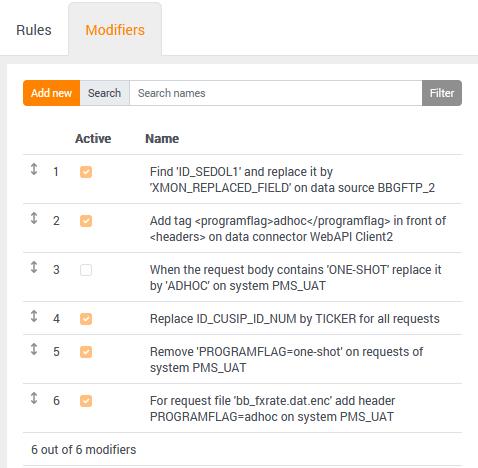
Example: As per the below snapshot, when the request includes the text “ID_SEDOL1” this will be replaced with the text “XMON_REPLACED_FIELD”.
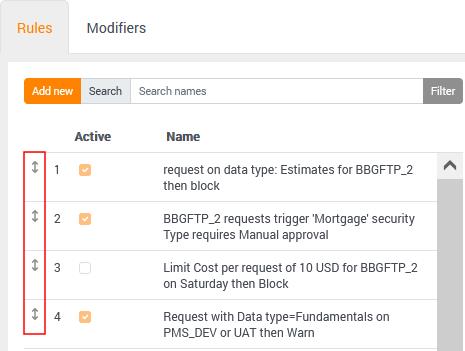
2.8.2Order and Priority
Once new rules are defined, they are added at the bottom of the list. The order or priority in which rules are checked can be adjusted with a simple drag-and-drop.
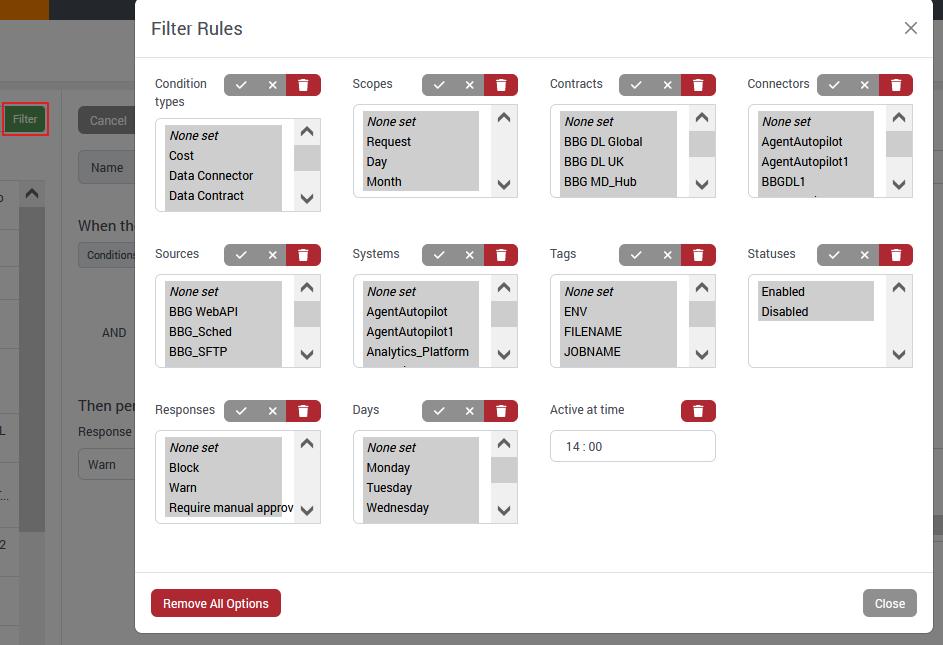
2.8.3Filter Rules
You can filter the rules by different conditions (Categories, Frequencies, etc.) and specifications (Tags, Days, Times, Status and Actions) to adjust the rules into a specified direction.
2.9 How to view available Users & Rights?
As Xmon is a fully hosted solution the creation, modification and deletion of users is administered by Xpansion team. Please contact us at xmonsupport@xpansionfts.com for any queries.
Your current user access rights can be viewed by clicking on ‘username’ (top-right of ribbon), then navigate to the ‘Permissions > User Assignment’ section:
Click on the ‘pencil / edit’ button to view user access for each user.
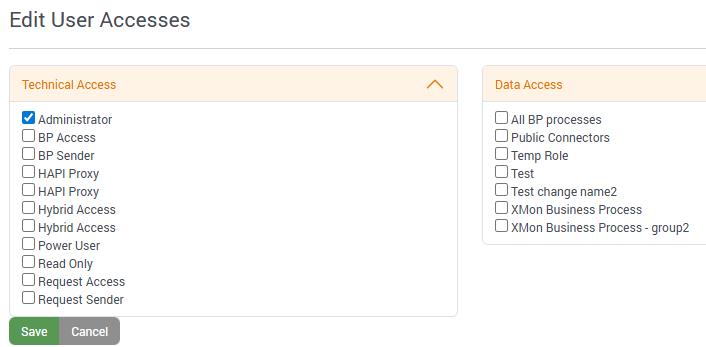
There are three different type of users:
1.Read Only (unable to make any changes)
2.Power User (can create and amend certain attributes)
3.Administrator (can create, amend and delete certain attributes. They can also edit other users access).
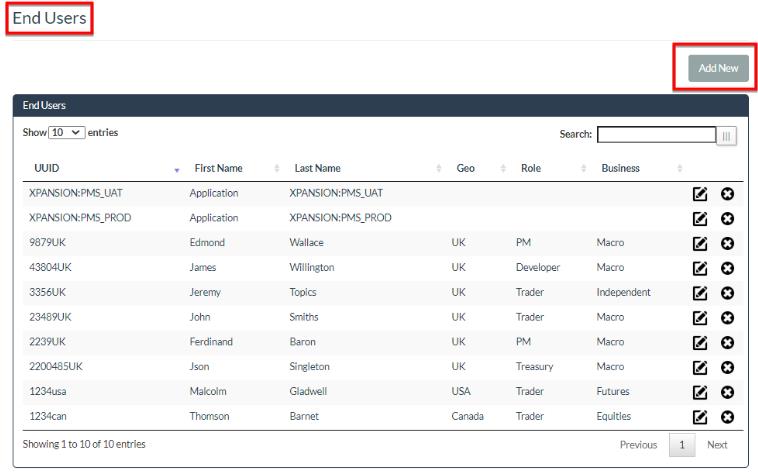
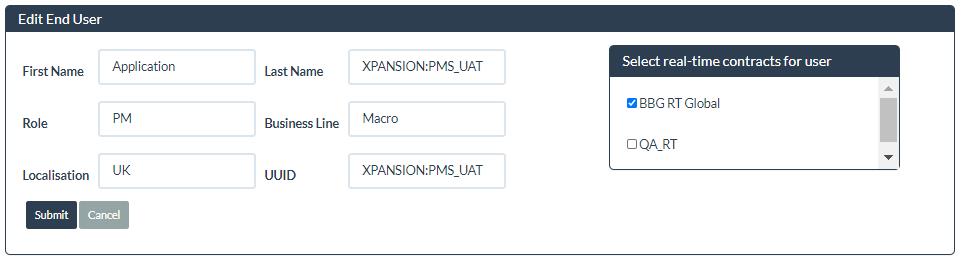
2.10 How to configure END USERS for RT Data Contract?
When the ‘Real-Time exchange subscription’ module is activated, you will access the list of Real-Time users to configure in the menu ‘Settings’ > ‘END USERS’. Each user will correspond to an individual in the company that has an account to receive Real-Time prices and has a list of Exchanges he subscribes.
To define a new END USER, go to the menu ‘Settings’ > ‘END USERS’ click on ‘Add New’ button, input the below information and hit ‘Submit’ when finished.
- UUID: The identifier from RT data provider for a specific user.
- First Name: input the first name of the user.
- Last Name: input the surname/family name of the user.
- Geo: input the geographical location.
- Role: input his/her role or job title.
- Business: input his/her assigned business line (Dedicated Fund/Trading Strategy/Desk).
- List of Real-Time Contracts: tick the Real-Time data contract he/she is assigned to.
To Edit or Delete an existing END USER, simply click on the icons  or
or , respectively.
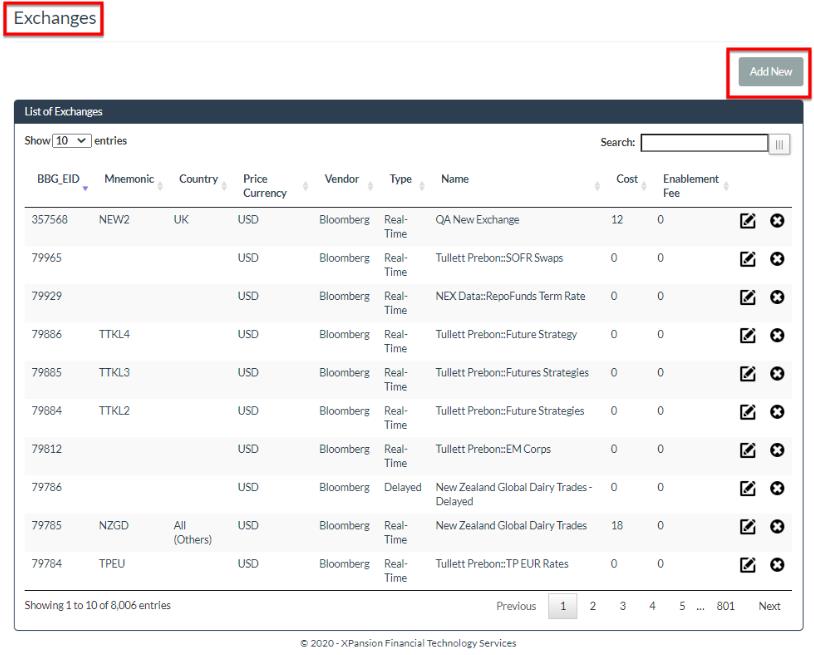
2.11 How to view and edit list of exchanges
When the ‘Real-Time exchange subscription’ module is activated, you will access the list of the Real-Time and Delayed price exchanges defined in your data contract universe in the menu ‘Settings’ > ‘MARKETS’. During the implementation of Xmon the initial list of Price Exchanges will be uploaded. Afterwards, the Administrator of the system will have the possibility to view, edit and insert new exchanges.
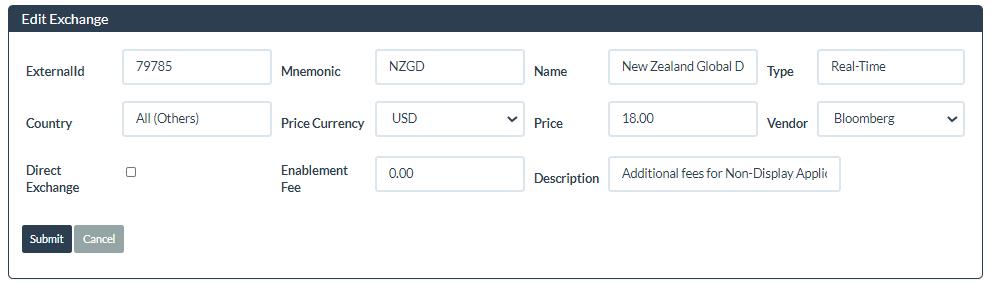
To define a new EXCHANGE, go to the menu ‘Settings’ > ‘EXCHANGES’ click on ‘Add New’ button, input the below information and hit ‘Submit’ when finished.
- External Id: the external data provider identifier of the exchange. This is generally a number.
- Mnemonic: the external data provider Mnemonic of the exchange. This is generally a short string.
- Market Name: the name of the exchange as displayed in the Xmon console.
- Market Type: input if this is delayed or Real-Time prices distributed for this exchange.
- Market Country: input the country of the exchange.
- Market USD: input the currency of the exchange.
- MBL: input the MBL code.
- MBO: input the MBO code.
- Pricing-Type: select between on-shore and off-shore. This depends of your business location versus the exchange location.
- Pricing Currency: the currency of the cost of the exchange subscription.
- Price: this is the cost of the subscription to this exchange.
- Vendor: External data provider name.
- Description: additional field for optional description.
To Edit or Delete an existing EXCHANGE, simply click on the icons  or
or , respectively.
2.12 How to view the FX table
The FX table is used to convert the cost of Exchanges subscription quoted in a foreign currency into USD for consolidation purposes.
The FX table is automatically populated with EOD prices from the ECB website: https://www.ecb.europa.eu/stats/exchange/eurofxref/html/index.en.html
They can be found in the menu ‘SETTINGS’ > ‘FX’ as shown in the screenshot below:

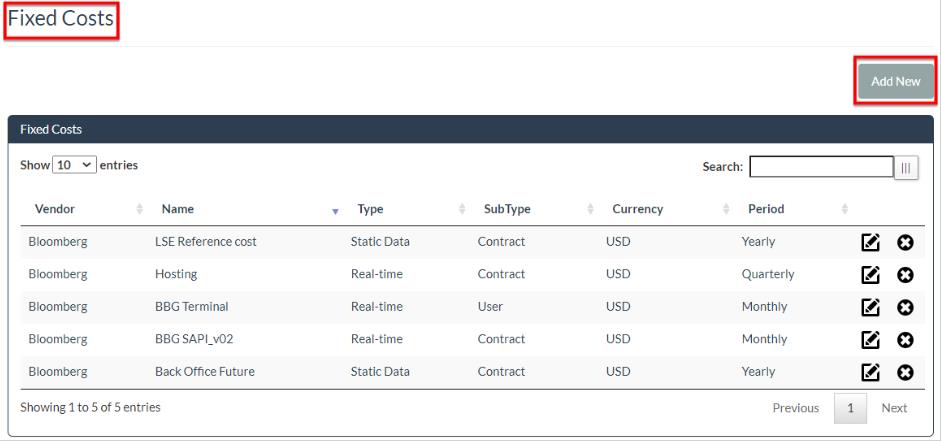
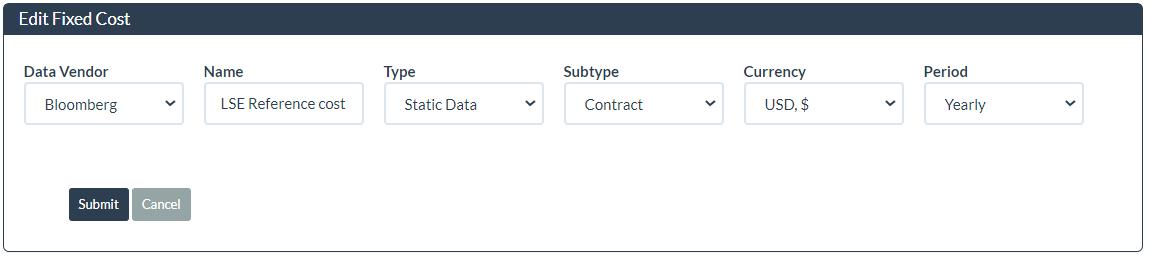
2.13 How to Configure Fixed Cost
Fixed cost can be associated with a Data Contract so Xmon can have a full picture of the data cost. For instance, fixed cost can be used to model annual data download subscriptions which will not be counted individual requests (like ‘Back Office files’ for Data License contract or ‘Real-Time Terminal’ cost by user for RT Contracts).
The configuration of the Fixed cost is done in the menu ‘SETTINGS ‘> ‘FIXED COSTS’. Click on the ‘Add New’ button and define the fields as described below:
- Data Vendor: select the vendor name for which the fixed cost is related to.
- Name: the name of the fixed cost to be identified in Summary reports.
- Type: select ‘Static’ if the fixed cost is relevant to a Data Download contract or ‘Real-Time’ if the item is related to Real-Time and Subscriptions monitoring contract.
- Subtype: Select ‘User’ if the cost repeated for each individual user is linked to a real-time contract or select ‘Contract’ if this is a single one of cost per contract.
- Currency: The currency of the cost.
- Period: The periodicity for the fixed cost to be paid.
Note: The amount of the fixed cost is defined at the ‘Data Contract’ level when selecting this fixed cost to apply to a particular contract.
To Edit or Delete an existing Connector, simply click on the icons  or
or , respectively.
2.14 How to define a Factor Matrix
The factor matrix will be applied to the standard pricing matrix in order to adjust the cost to the real effective cost after Optimisation is done within the Bloomberg billing process. This way, the factor is mapped to the vendor Optimisation factor on the itemised invoice.
The factor is input as a 100% of application. Hence 75 means that a factor of 75% will be applied to the unit cost coming from the standard pricing matrix/rate card, which needs to be applied manually.
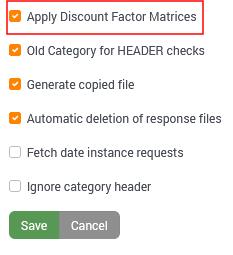
Step 1: To define a new matrix for a Data Source, you first need to tick ‘Apply Discount Factor Matrices’ in the definition of the given Data Source.
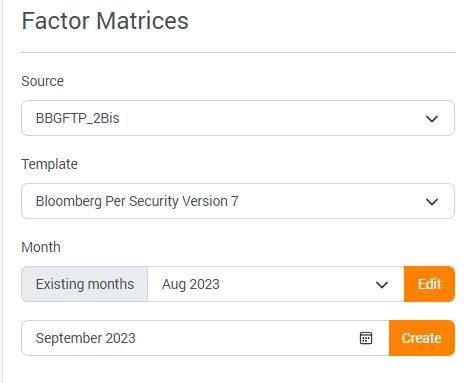
Step 2: Once the Data Source has been defined with ‘Apply Discount Factor Matrices’ ticked, go to the menu ‘SETTINGS’> ‘FACTOR MATRICES’, select a data source and the applicable pricing matrix/rate card.
To add a new factor matrix, click on the ‘Create’ button after selecting the correct month. You can then adjust the display factors manually. By default, a new matrix will inherit the level of factor of the closest past month defined. To edit an existing Factor Matrix, click on Edit after selecting the desired month.
Warning: Once defined, the factor matrix needs to be activated in the definition window of the Data Source by marking the field ‘Apply Discount Factor Matrices’.

2.15 Tag requests
Xmon allows you to define tags at the request level to identify and classify your requests easily to support your downstream reporting. Xmon permits you to set up to 5 different tags. The tags assigned to the request can then be seen in the table REQUESTS in the DASHBOARD menu or extracted in the STD03 Standard Reports in .csv format.
1.To create Tags, go to the SETTINGS > TAGS menu, edit ‘Tag1’ and input a short name into Label field and click on ‘Submit’:
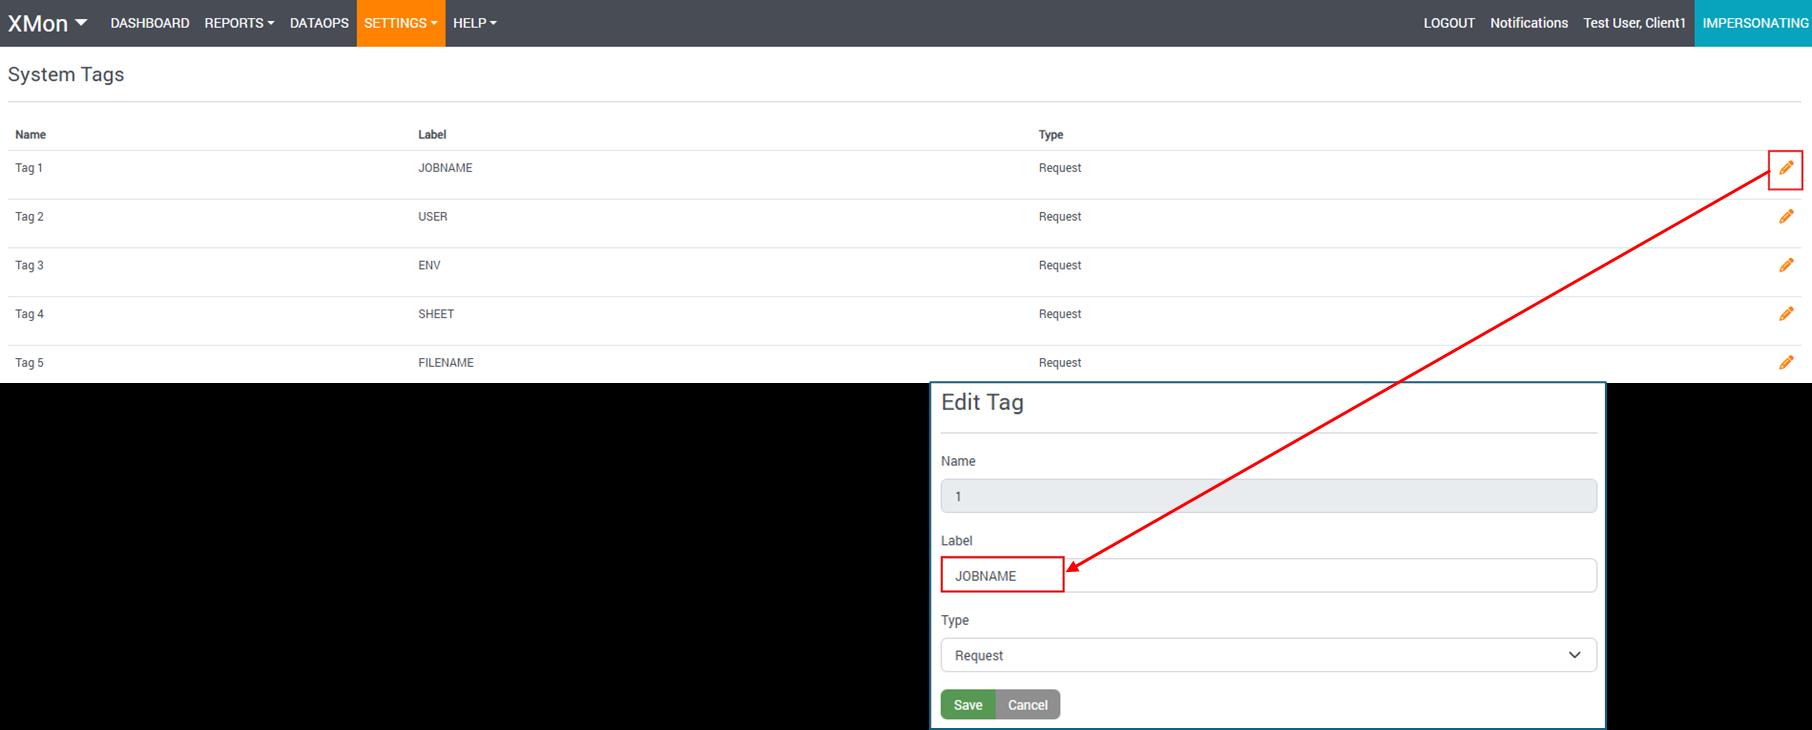
2.In each request file, typically in the HEADER, add a line starting with the logic:
#tag [Tag1.Label]=Value of Your Tag
Example:
#tag Jobname=QA_Pricing
For WebAPI Calls, the .xml format should follow the sample below:
<xmon xmlns="https://xmongw.xpansionfts.com">
<jobname>QA_Pricing</jobname>
</xmon>
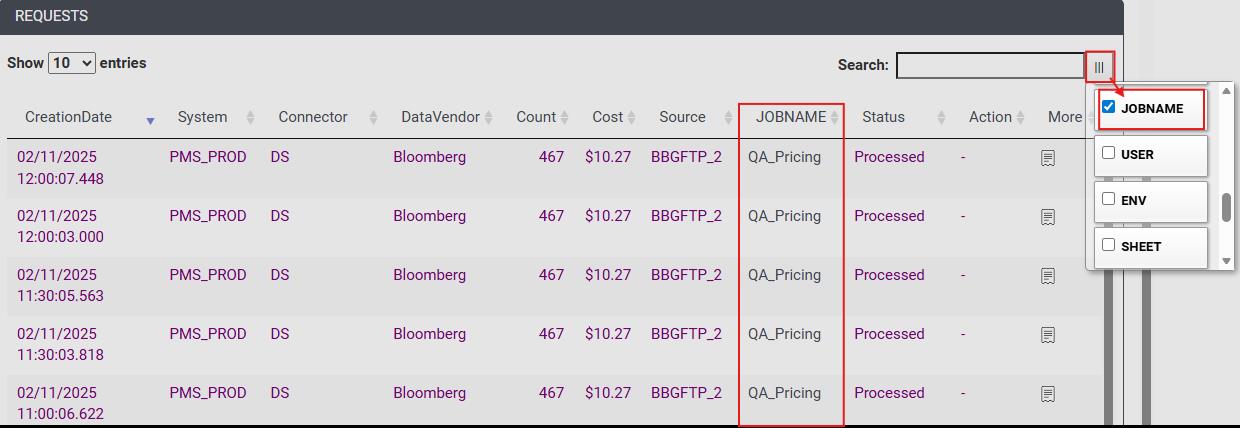
3.Process the request file as usual. To view the tag assigned to that request in the Xmon Dashboard, select the ‘Column chooser’ button on the Top-Right of your REQUESTS table in the Dashboard menu and select the Tag name:
4.To extract the list of requests including the tags column in .csv format, simply navigate to the menu REPORTS > STANDARD REPORTS and generate the STD03 report for the appropriate start and end dates.
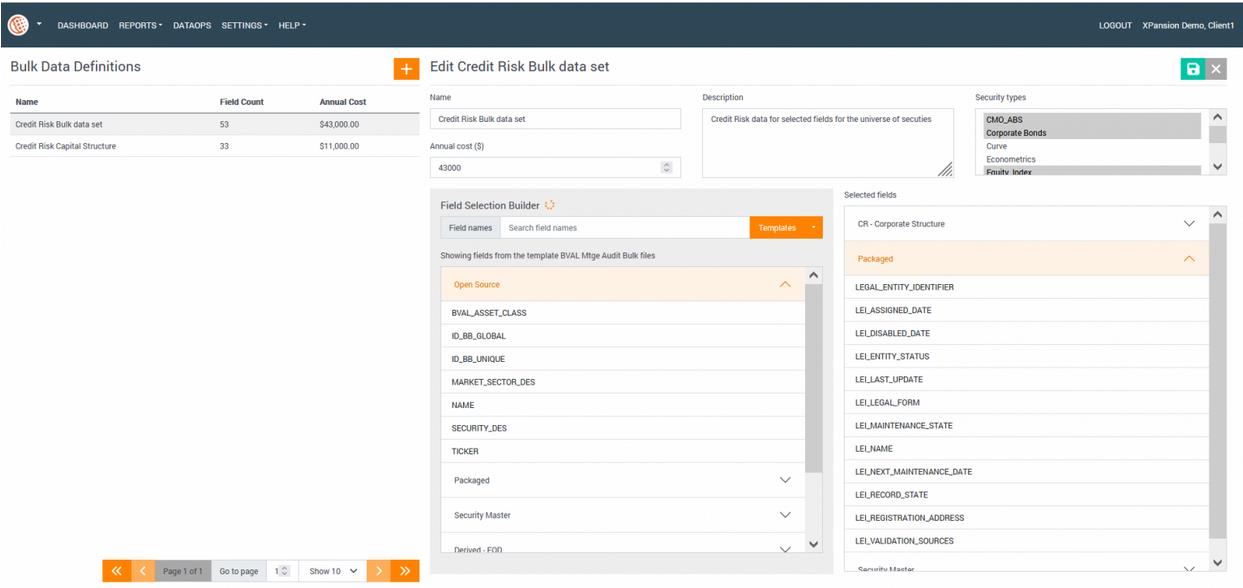
2.16 How to Define a Bulk Data Set
Through annual bulk data file subscriptions, Bloomberg allows institutions to better manage costs associated with large-scale data usage. The subscription covers defined field sets, asset types, or regions for a one-time annual fee, eliminating any monthly per-security charges.
The Bulk Data Definition section in Xmon allows you to:
- define annual bulk data subscriptions (like Bloomberg Back Office files) with their associated costs, security types, and field coverage,
- enable Xmon to run cost simulations comparing your current ad-hoc requests against bulk file alternatives,
- help determine whether existing bulk subscriptions are cost-effective or if new bulk subscriptions would reduce overall Bloomberg spend.
To define the Bulk Data files in Xmon:
- Go to the menu SETTINGS > BULK DATA.
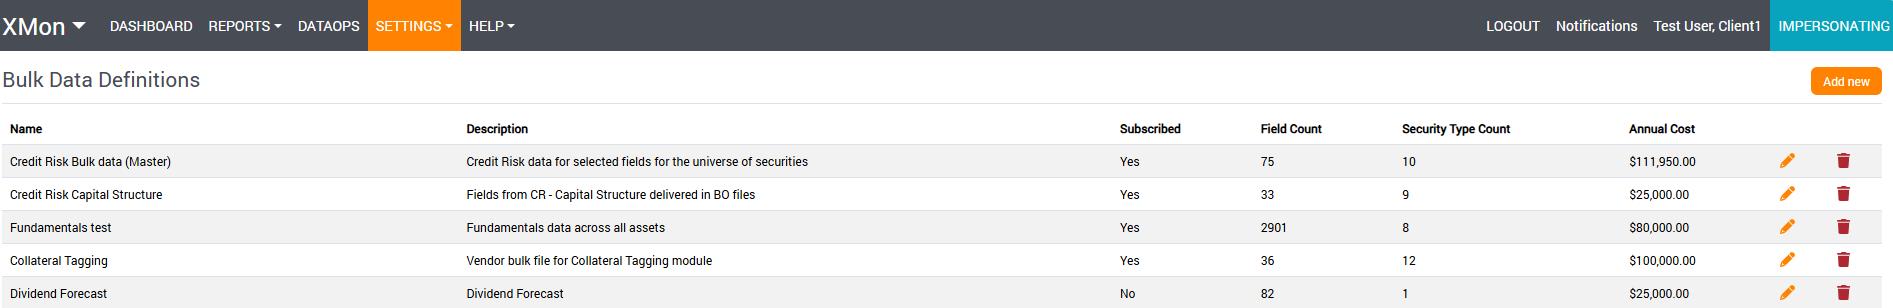
Create a new Bulk Data Definition:
- To create a new subscription, click the ‘Add new’ button.
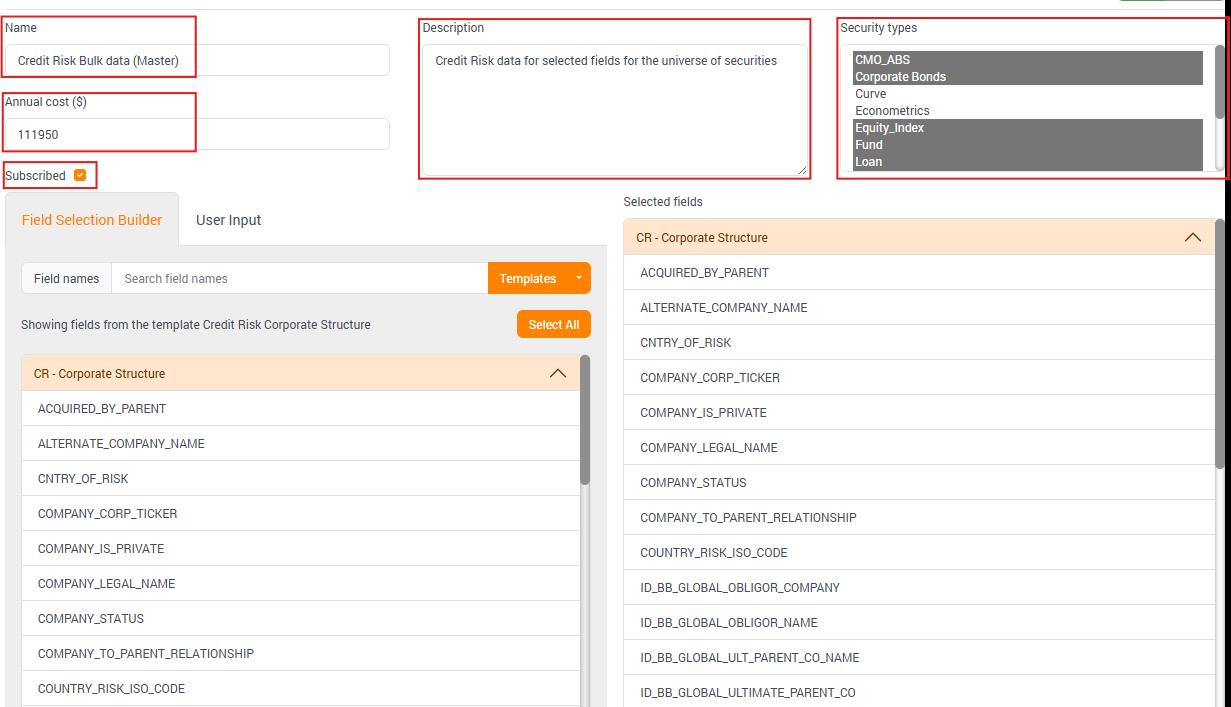
- Populate the fields Name, Annual Cost and Description, and select Security Types present in your bulk data subscription.
- If you already subscribe to this Bulk data subscription, tick the ‘Subscribed’ box.
- Use the Fields Selection Builder to select fields from the list of templates oryou’re your own list using the ‘User Input’ section.
- When done click on Save in the top right corner.
2.17 Permissions
Permissions specify what tasks users can perform and what features users can access. To access the Profile Data Access, go to the menu ADMIN (click your name in the top-right corner) > PERMISSIONS > DATA ACCESS. You can enable user permissions in permission sets and custom profiles.
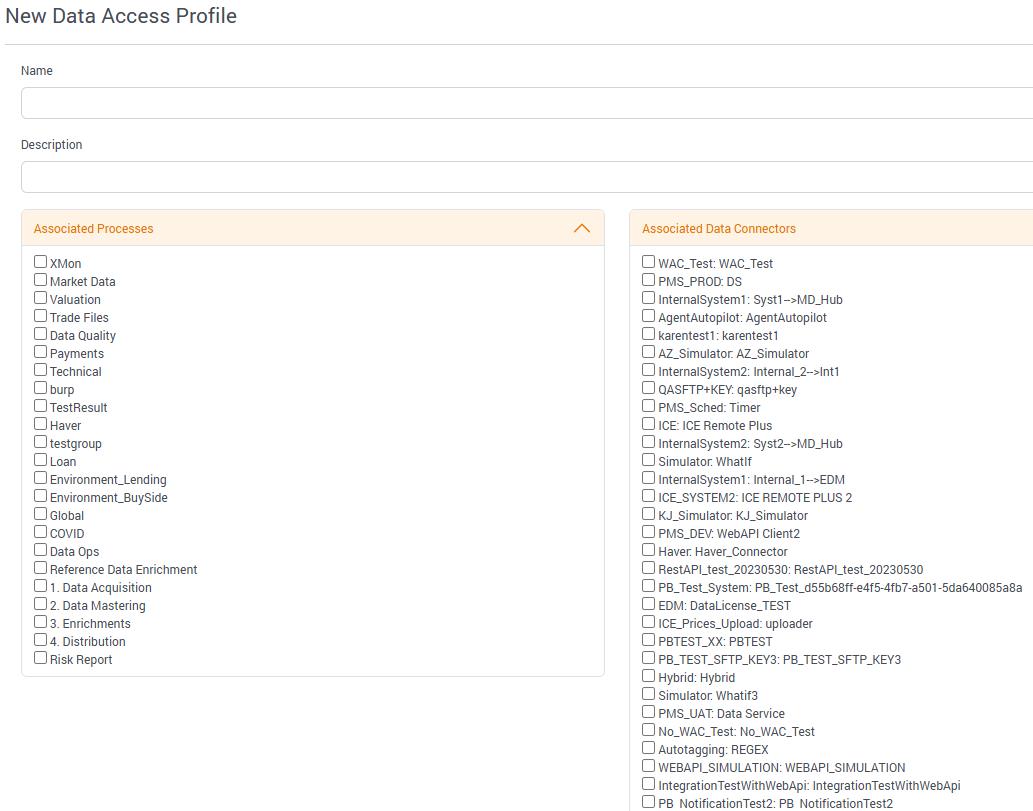
2.17.1Profile Data Access
You will be able to create various profiles for different users and assign different access to each one. Profiles define how users access objects and data and what they can do. There are two data types:
●Associated Processes
●Associated Data Connectors
The key difference between the two profiles is that users might have access to some data connectors and business process modules.
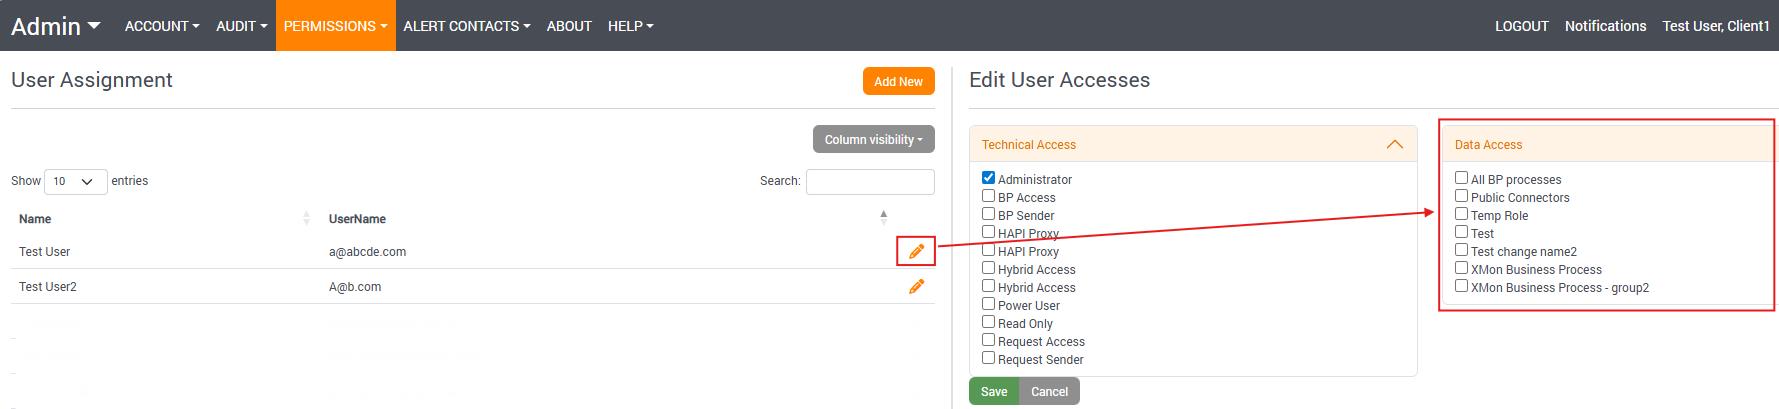
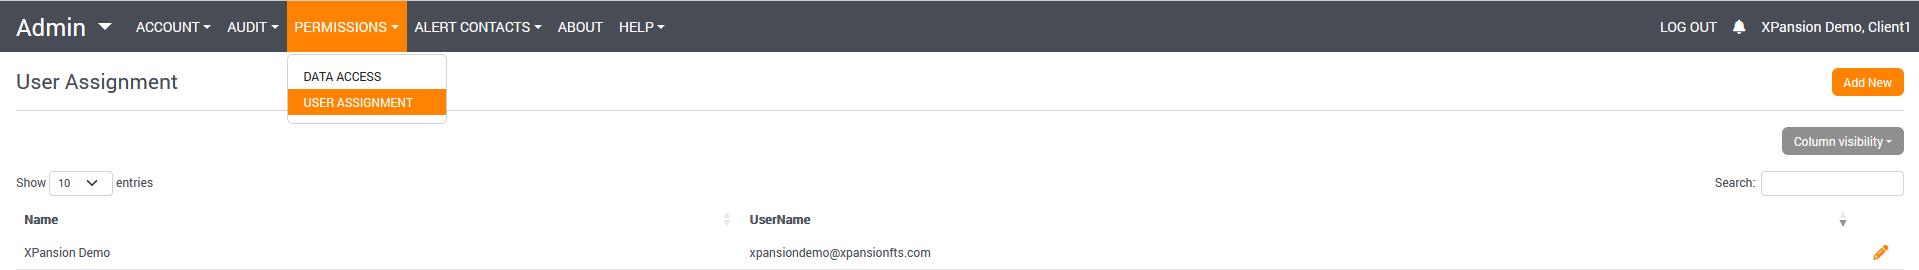
2.17.2User Assignment
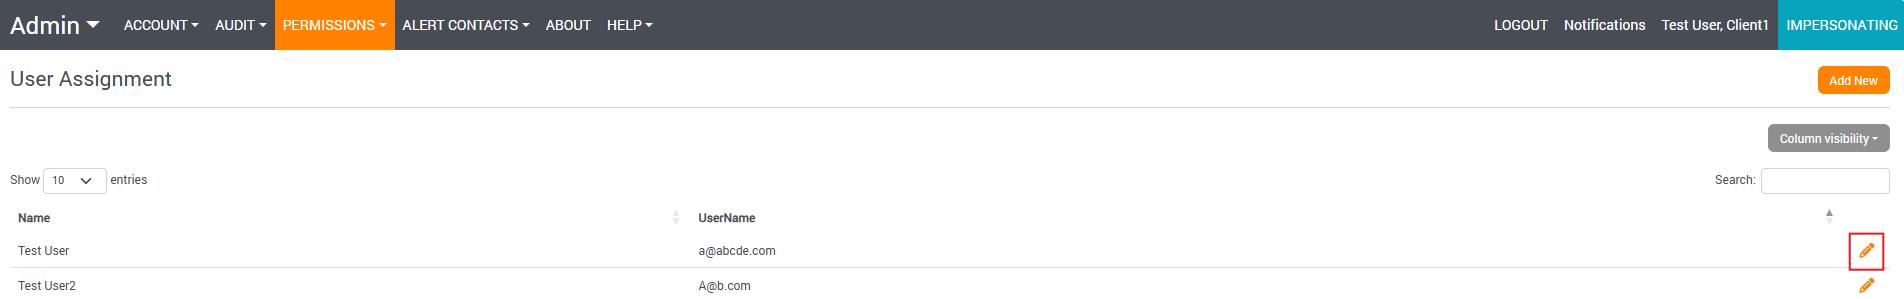
To access the User Assignment, go to the menu ADMIN (click your name in the top-right corner) >PERMISSIONS > USER ASSIGNMENT.
Here, you can assign the access that you’ve created in the PROFILE DATA ACCESS to the specified users by clicking the edit button and selecting the applicable Data Access box.
3 Reports and Analysis
3.1Real-Time Dashboard
The real-time Dashboard in Xmon enables you to view the pre-defined rules and their current quota level, the Month-To-Date consumption as well as the most recent requests.
The Dashboard has an Auto Refresh mode (every 30 seconds) which you can activate by clicking on the ‘Autorefresh’ button on the top right of the screen. The default setting for a new session is ‘OFF’.
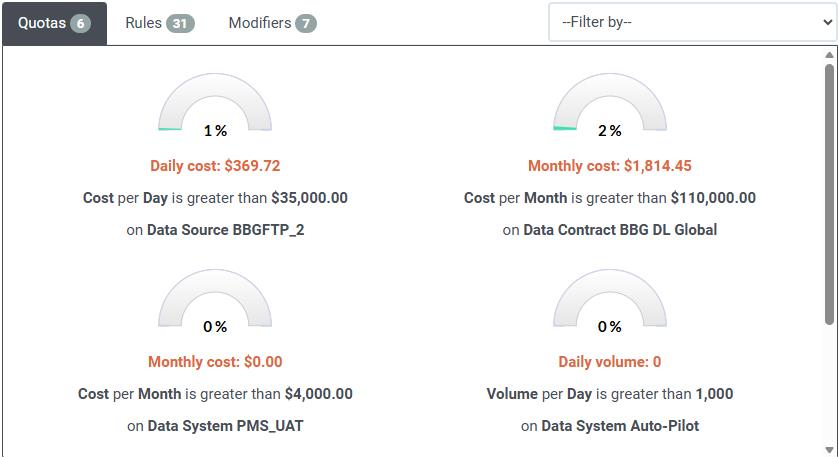
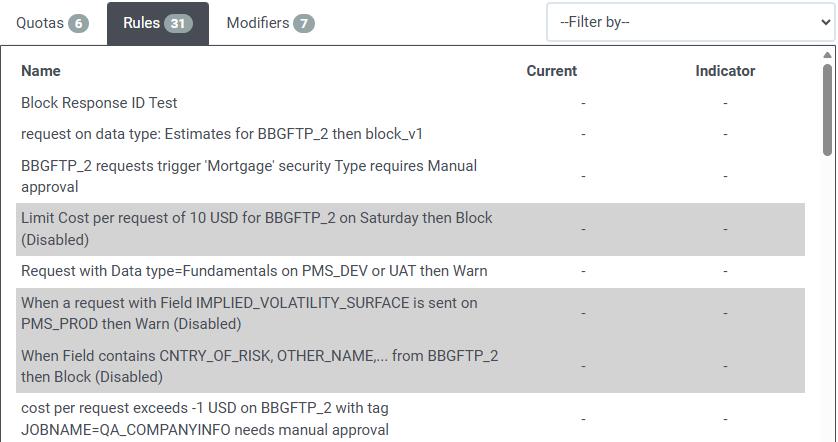
3.1.1Quotas, Rules and Modifiers
The Quotas, Rules and Modifiers section of the Xmon Dashboard provides real-time visibility and control over your reference data consumption through proactive monitoring and automated governance.
This section displays active rules that monitor and control Bloomberg data requests in real-time, helping prevent/highlight unexpected cost spikes and ensuring compliance with your data usage policies.
Quotas:
- Visual gauges show current utilisation against daily or monthly based rules
- Color-coded indicators (green/yellow/red) provide at-a-glance status
- Percentage completion helps predict when limits might be reached
- Updates in real-time as requests are processed
Rules:
- Shows all rules with their status and descriptions (inactive rules are in grey)
- Displays rule conditions (cost limits, volume thresholds, system restrictions)
- Filters by selected Data Contract, Data Source, or System for focused monitoring
Modifiers:
- Shows all modifiers with their descriptions (inactive modifiers are in grey)
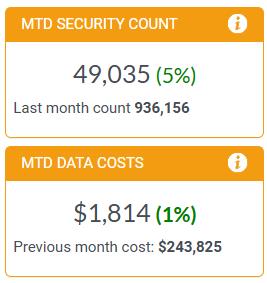
3.1.2‘Month-To-Date’ Widgets
- MTD Security Count: is the number of individual securities that have been requested since the beginning of the current month.
- MTD DATA COST: is the Month-To-Date Cost across all monitored systems for the current month
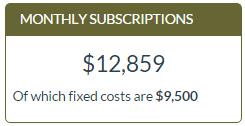
3.1.3‘Monthly Subscriptions’ widget
When the ‘Real-Time exchange subscription’ module is activated, the widget ‘Monthly Subscriptions’ is displayed on the right-hand side of the Dashboard and shows the sum of all the monthly fixed costs and exchange subscription costs monitored.
The bottom of the widget is indicating only the monthly fixed cost.
3.1.4‘Requests’ Dashboard
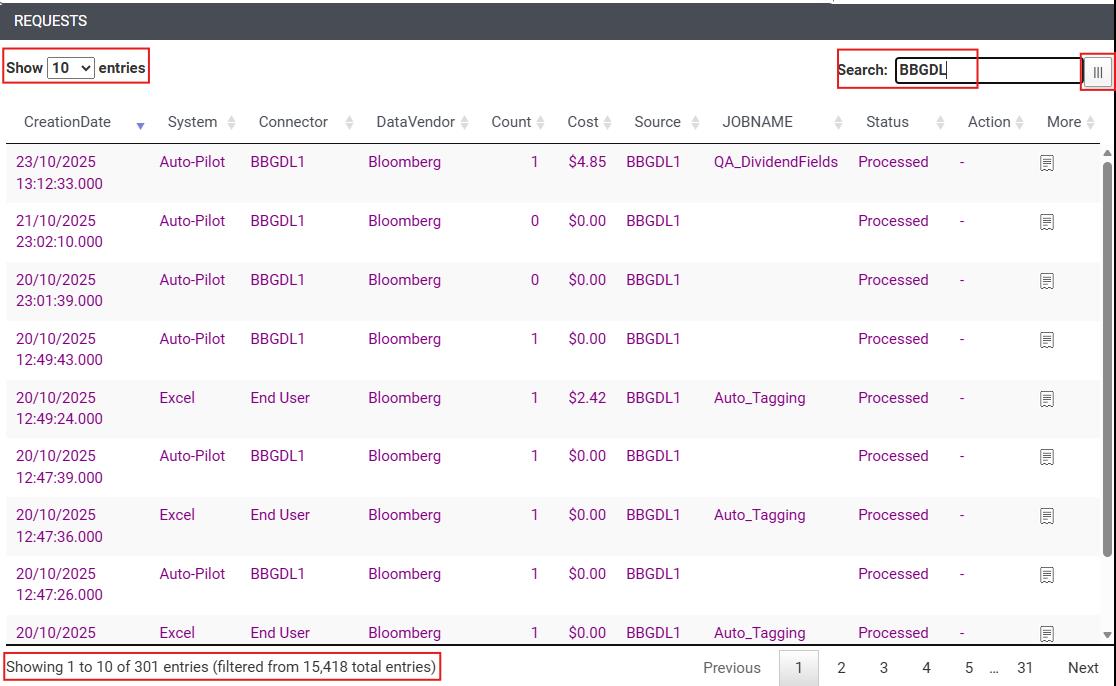
The Requests section of the Xmon Dashboard provides comprehensive real-time visibility into all Bloomberg data requests flowing through your environment, serving as your central command centre for monitoring and managing reference data activity.
This section displays a detailed, real-time log of all data requests, allowing you to track, analyse, and take action on individual requests as they are processed through Xmon. The key features include:
Request Table:
- Real-time Updates: Shows all requests as they are received and processed
- Comprehensive Details: Displays request ID, timestamp, system/connector, data source, estimated cost, and current status
- Status Tracking: Monitor requests from initial receipt through final processing (Sending, Received, Blocked, Pending Manual, etc.)
- Cost Visibility: See estimated first cost and multi-hit charges for each request
Interactive Controls:
- Search & Filter: Quickly find specific requests using the search engine across any displayed field
- Pagination: Navigate through request history with configurable entries per page
- Column Chooser: Customise displayed columns including tags and additional metadata
- Action Buttons: Take immediate action on requests requiring manual approval (Accept/Reject)
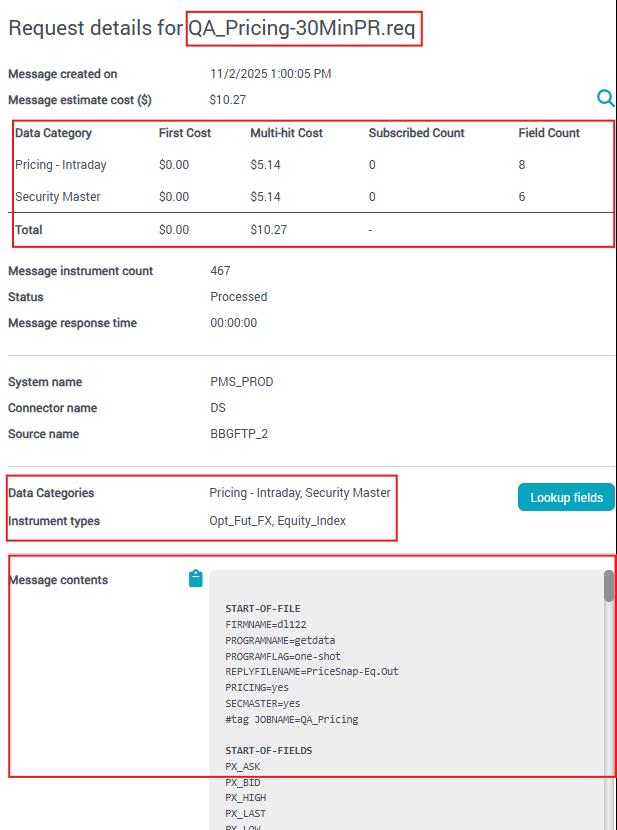
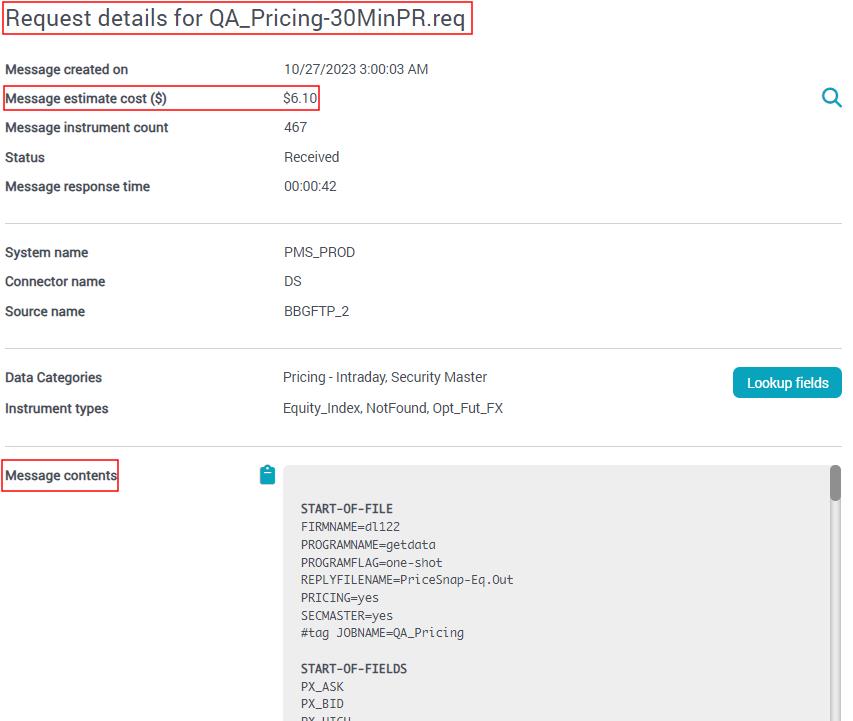
Request Details:
- More Button: Access comprehensive request details including:
- Complete message contents and field lists
- Securities requested and instrument types
- Data categories triggered and cost breakdown
- System information and response times
3.2Understand the Request Status and workflow
Once a request is raised it is automatically picked up by Xmon and validated versus any rule(s) that might apply. The request will display one of the statuses below, as applicable:
Active Mode Processing Statuses:
- Sending (Auto): Request has passed all rule validations and is being automatically forwarded to the vendor for processing
- Sending (Manual): Request was manually approved after being flagged and is now being sent to the vendor
- Waiting Source: Request file has been uploaded to the vendors servers and Xmon is awaiting the response file
- Received: The vendor has successfully processed the request and returned the response data to your system
Control & Approval Statuses:
- Blocked: Request has been stopped due to rule violations and will not be sent to the vendor
- Pending Manual: Request requires manual approval due to cost thresholds, compliance rules, or other configured conditions
- Manually Rejected: User has reviewed and rejected a pending request, preventing it from being sent to the vendor
Error & Timeout Statuses:
- Time Out (Manual): Request was pending manual approval but exceeded the configured timeout period and was automatically cancelled
- Time Out (Source): The vendor did not respond within the expected timeframe and the connection timed out
- Error: Technical error occurred during request processing due to formatting issues, system problems, or other technical reasons
Special Processing Statuses:
- Processed: Request has been analysed and costed by Xmon but not sent to the vend (used in passive monitoring or autopilot mode)
- Adjustment: Manual cost adjustment entry created for invoice reconciliation purposes
- Adjustment Cancelled: Previously created bill adjustment has been deleted and removed from reporting.
3.3Reporting and Analysis Capabilities
3.3.1Daily Cost Reporting
The Reports > Cost menu provides powerful visualisation tools to analyse your daily spending patterns and investigate cost fluctuations across your systems.. The cost is based on the per security pricing model and is calculated overnight.
Cost Visualisation Dashboard:
- Interactive Chart: Displays total daily costs broken down by system for any selected day, month, or year.
- Customisable Views: Filter and adjust the chart to focus on specific time periods or systems
- Trend Analysis: Identify patterns and anomalies in your daily Market Reference Data spending
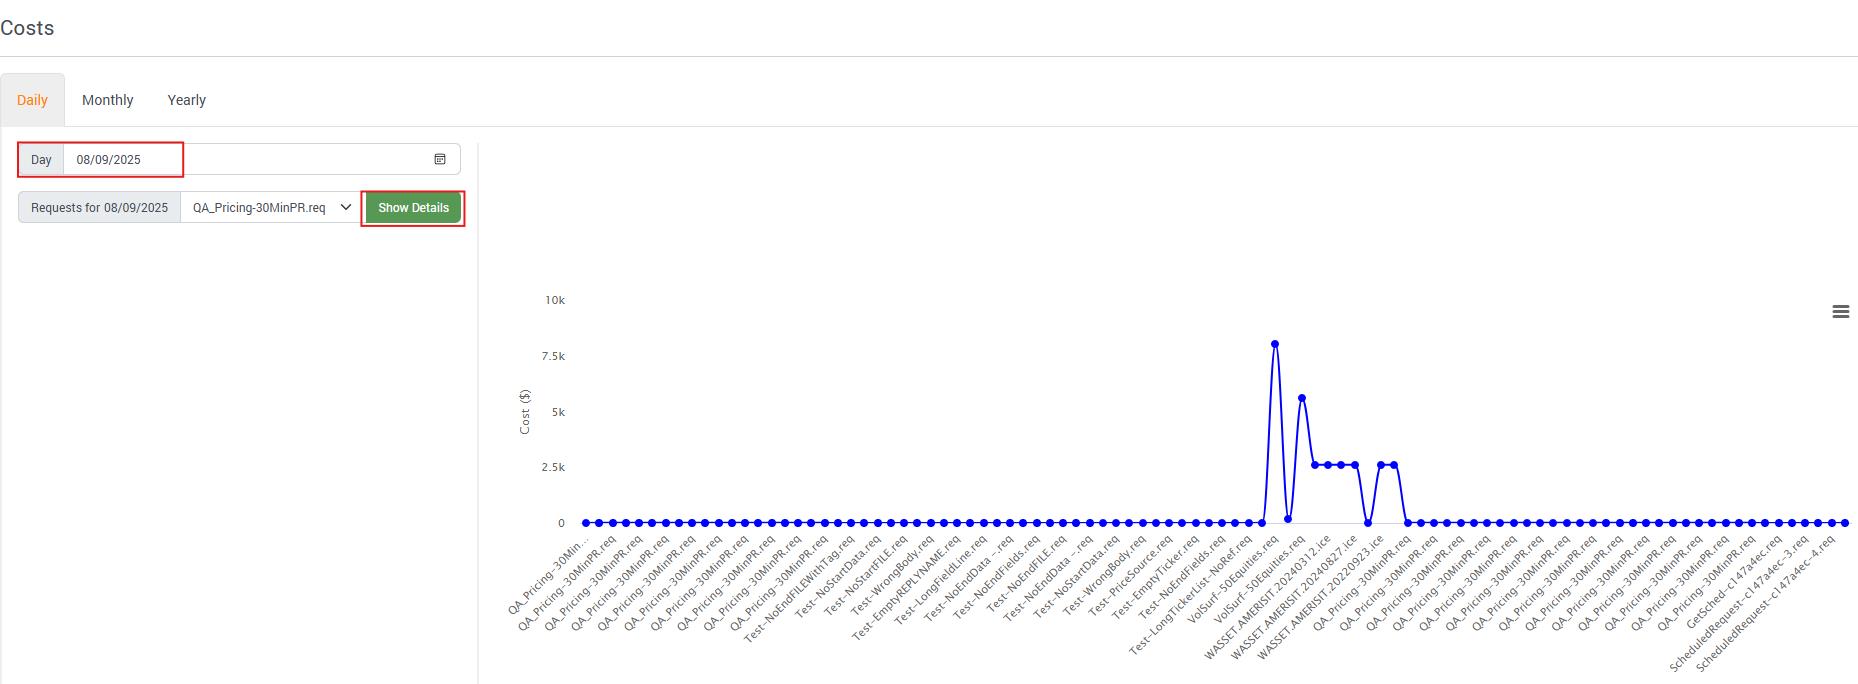
Drill-Down Investigation:
When you identify a cost spike or unusual pattern:
1.Select ‘Daily’ and then the Target Day: Click on any day in the chart to view all requests for that specific date
2.Request Analysis: A detailed dropdown displays all requests that contributed to that day's costs
3.Spike Investigation: Use the 'Show Details' button to examine the full details of the selected request
4.Root Cause Analysis: Access complete request information including:
- System and connector that generated the request
- Securities and fields requested
- Data categories triggered
- Cost breakdown (first cost vs. multi-hit)
- Request timing and processing details
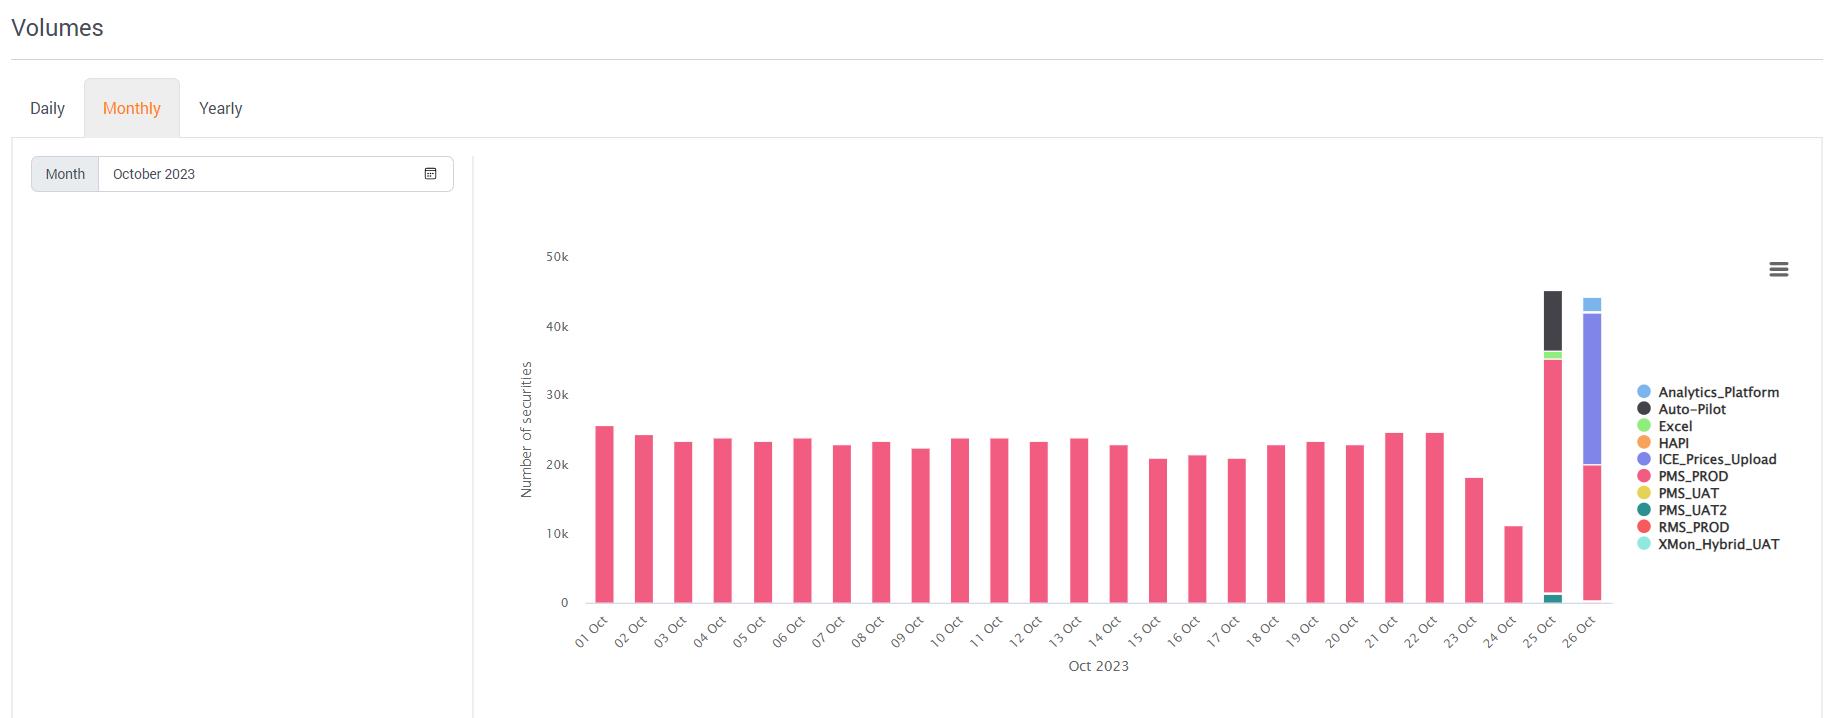
3.3.2Daily Volume Reporting
In the same logic as above, the menu Reports > Volume will enable you to view and investigate the spike in market data downloads based on the volume of securities requested.
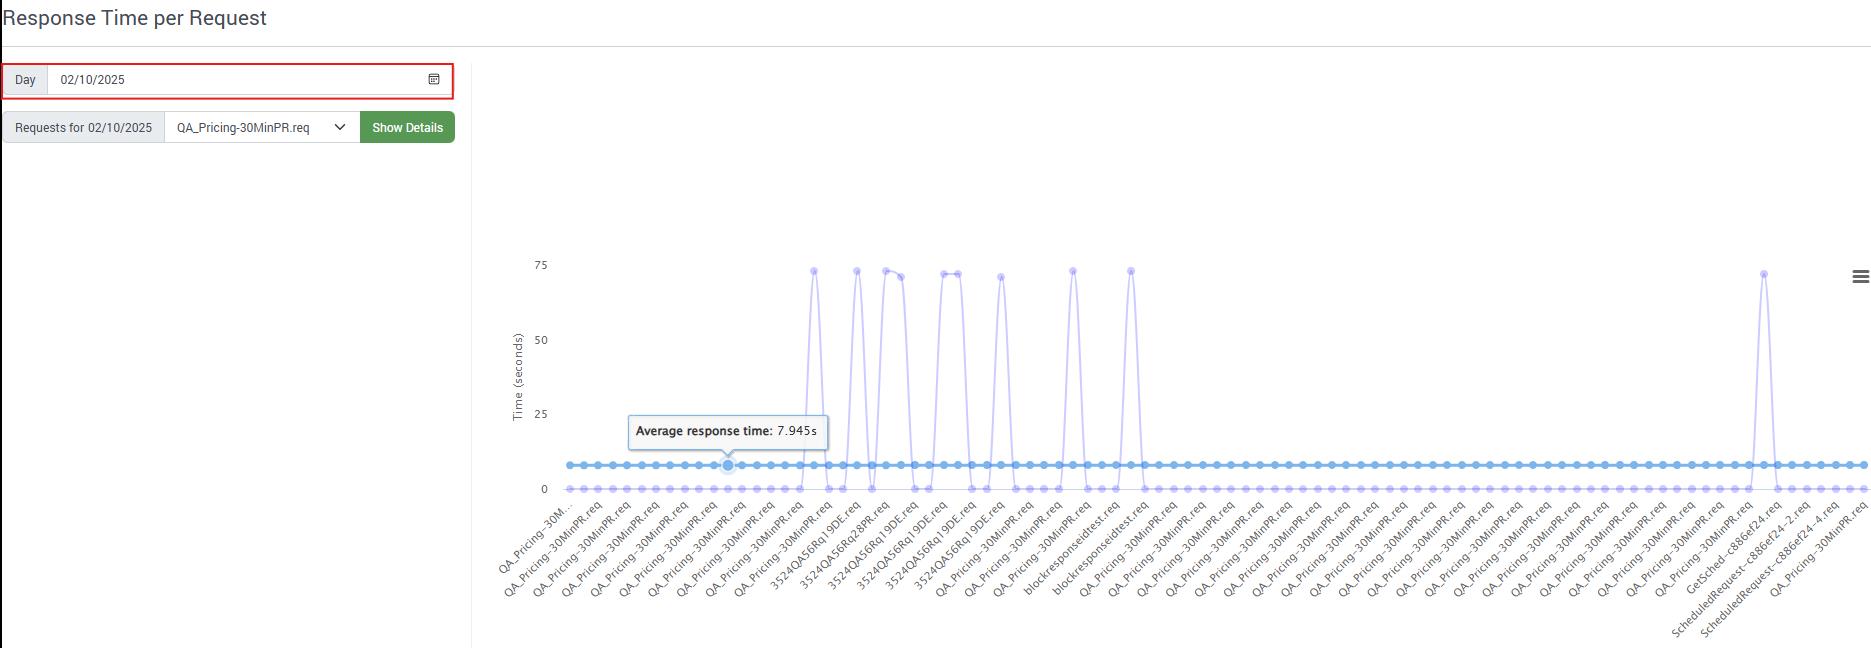
3.3.3Review the Response Time of a Data Provider
The Reports > Statistics menu provides comprehensive performance analytics to monitor and analyse vendor response times and service quality.
Response Time Analytics:
- Real-Time Tracking: Xmon timestamps both request submission and response receipt, enabling precise response time calculations
- Visual Performance Charts: Interactive graphs display vendor response times for your selected date range
- Average Performance Line: The blue trend line shows average response times, helping identify performance patterns
Service Level Monitoring: Track vendor performance against your contracted SLA requirements.
3.4Cost & Usage Explorer Report
Cost & Usage Explorer is Xmon’s Business Intelligence reporting tool that transforms raw usage data into actionable insights. This reporting tool enables you to:
1.Build customised reports tailored to specific analysis needs.
2.Share insights with stakeholders across your organisation.
3.Facilitate data-driven discussions about cost optimisation.
4.Support strategic decision-making with comprehensive analytics.
Navigate to REPORTS > COST & USAGE EXPLORER
The information used to populate the various dashboards comes from two sources:
Verification Report Based Analysis:
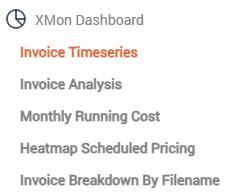
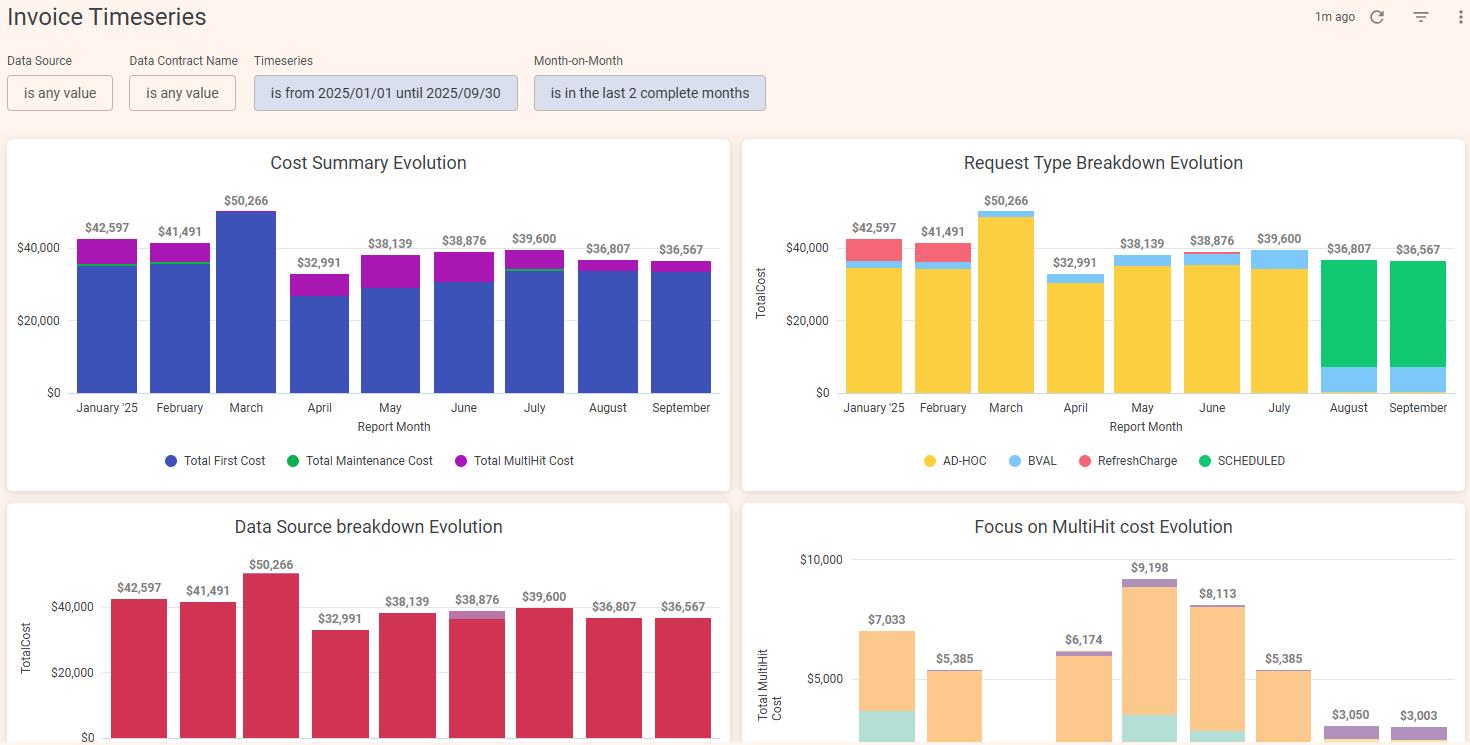
1.Invoice Timeseries - Cost trends and patterns over time
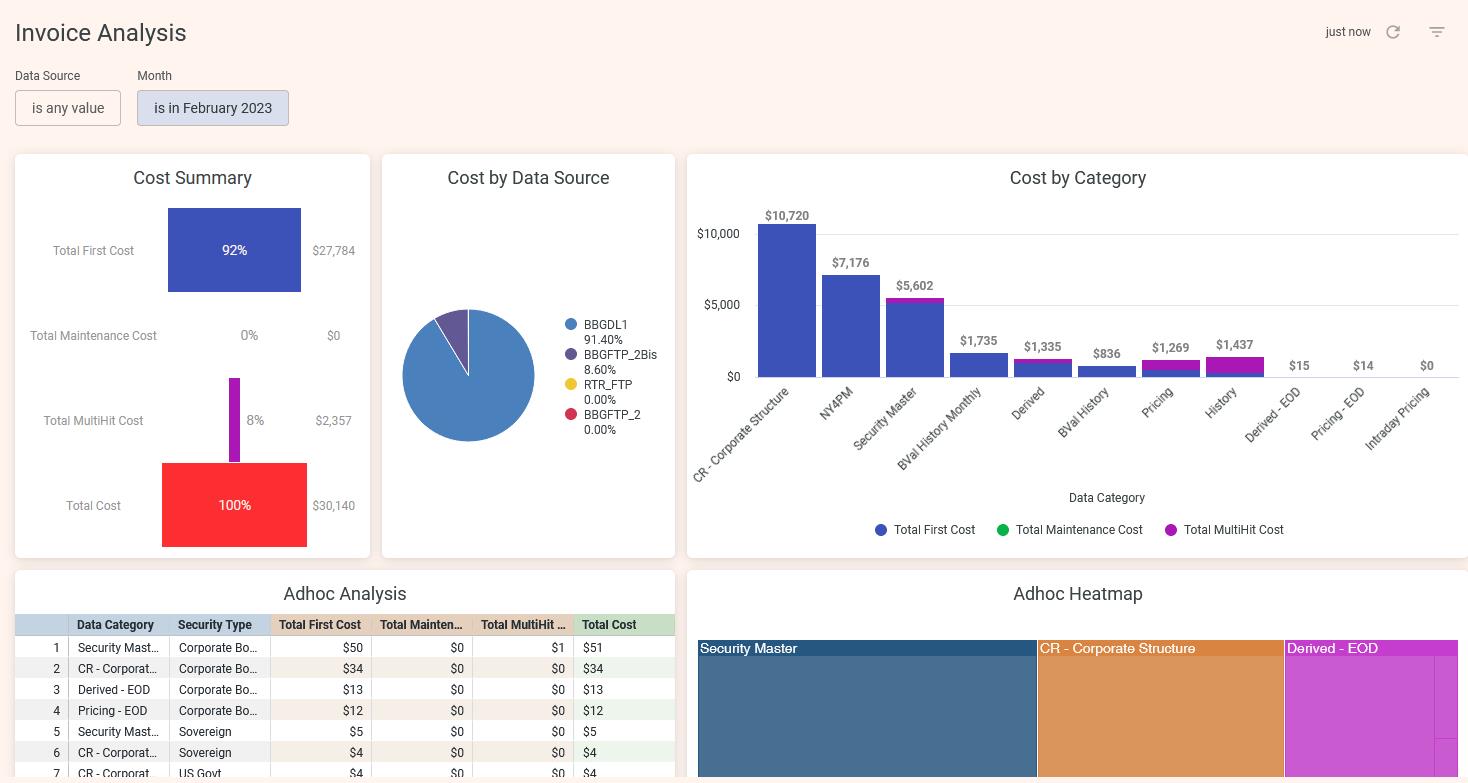
2.Invoice Analysis - Historical cost profiles from Detailed Itemised Invoice data
3.Invoice Breakdown By Filename
Request-Based Analysis:
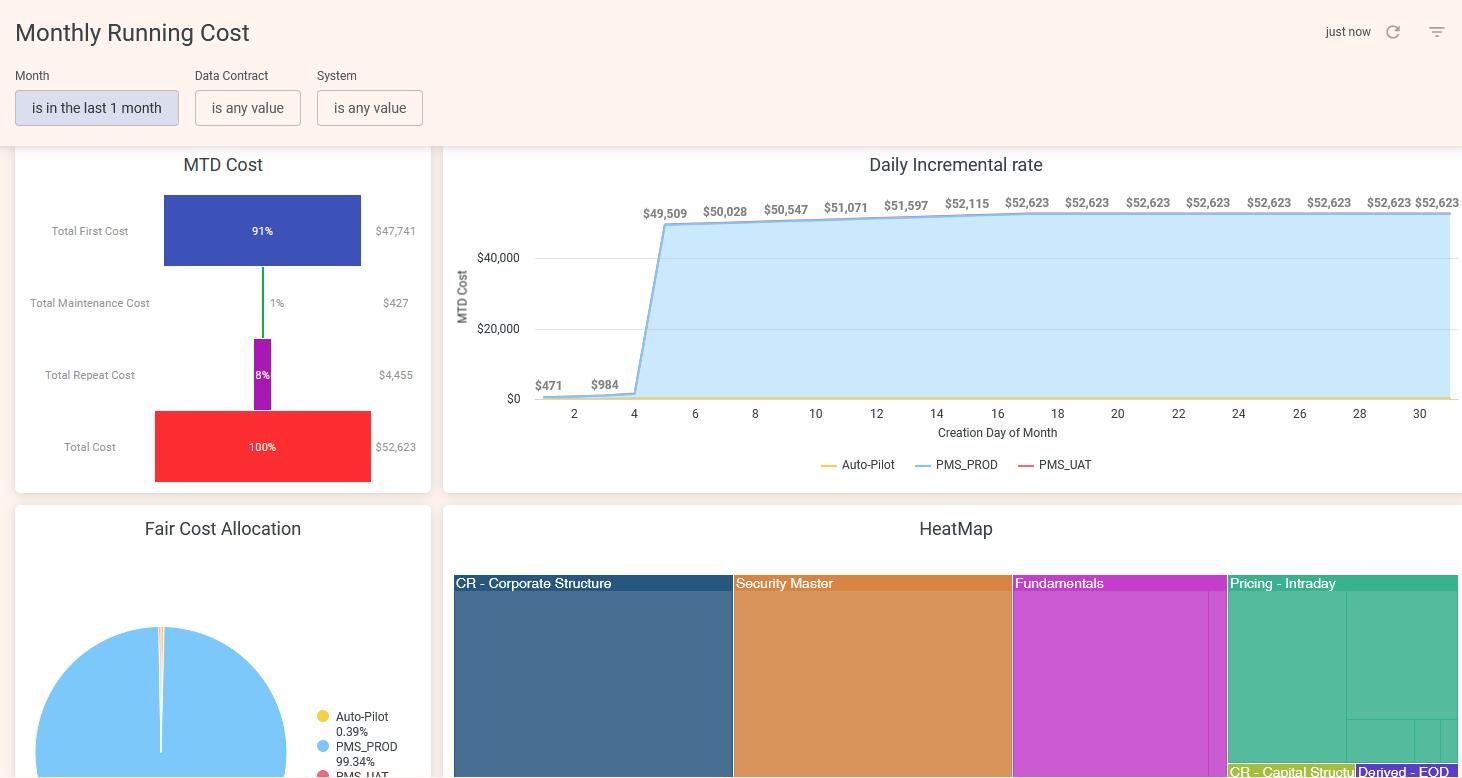
1.Monthly Running Cost - Cost allocation across systems using Pay As You Go pricing
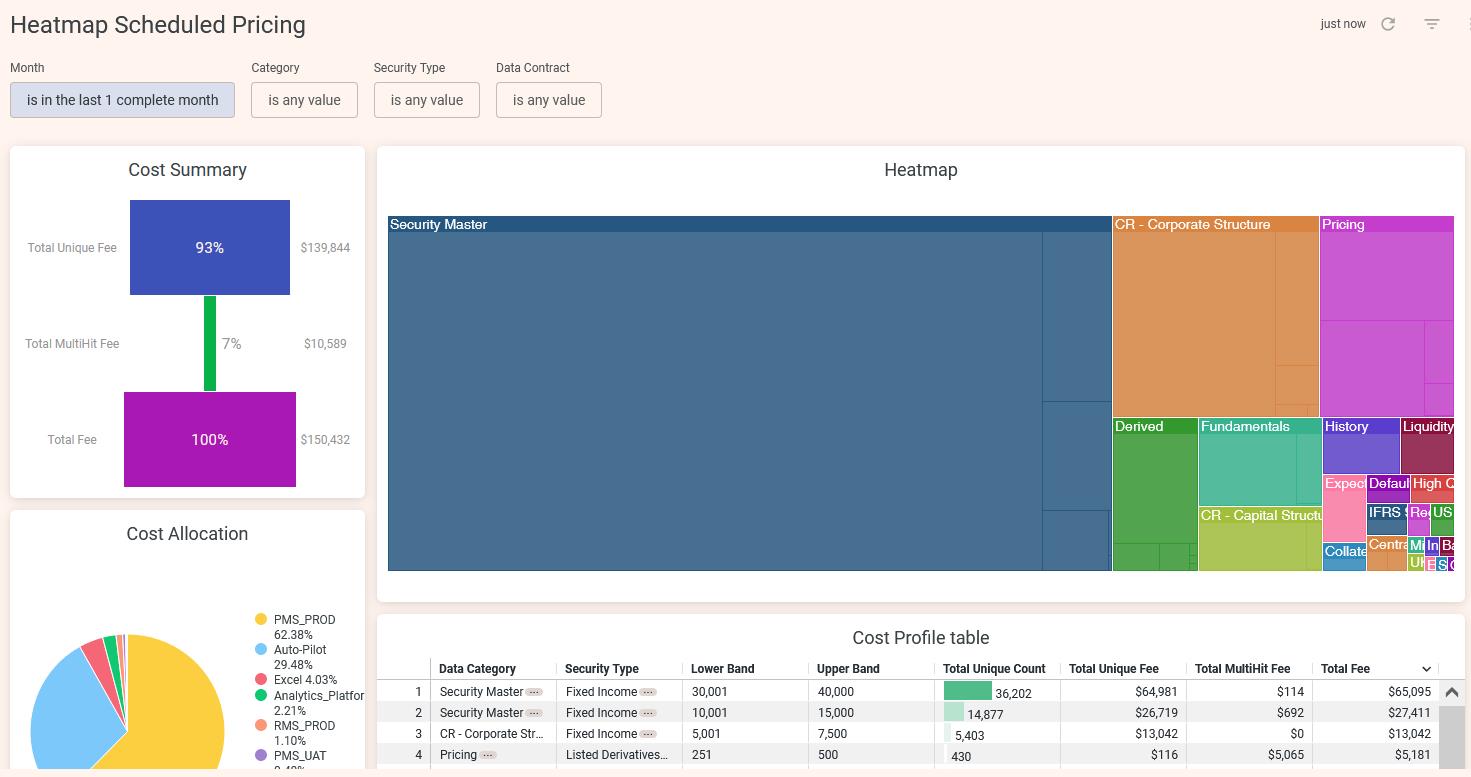
2.Heatmap Scheduled Pricing - Band pricing model simulation
Invoice Timeseries and Invoice Analysis provide a detailed cost profile over the last 12 months, based on the Detailed itemised invoice.
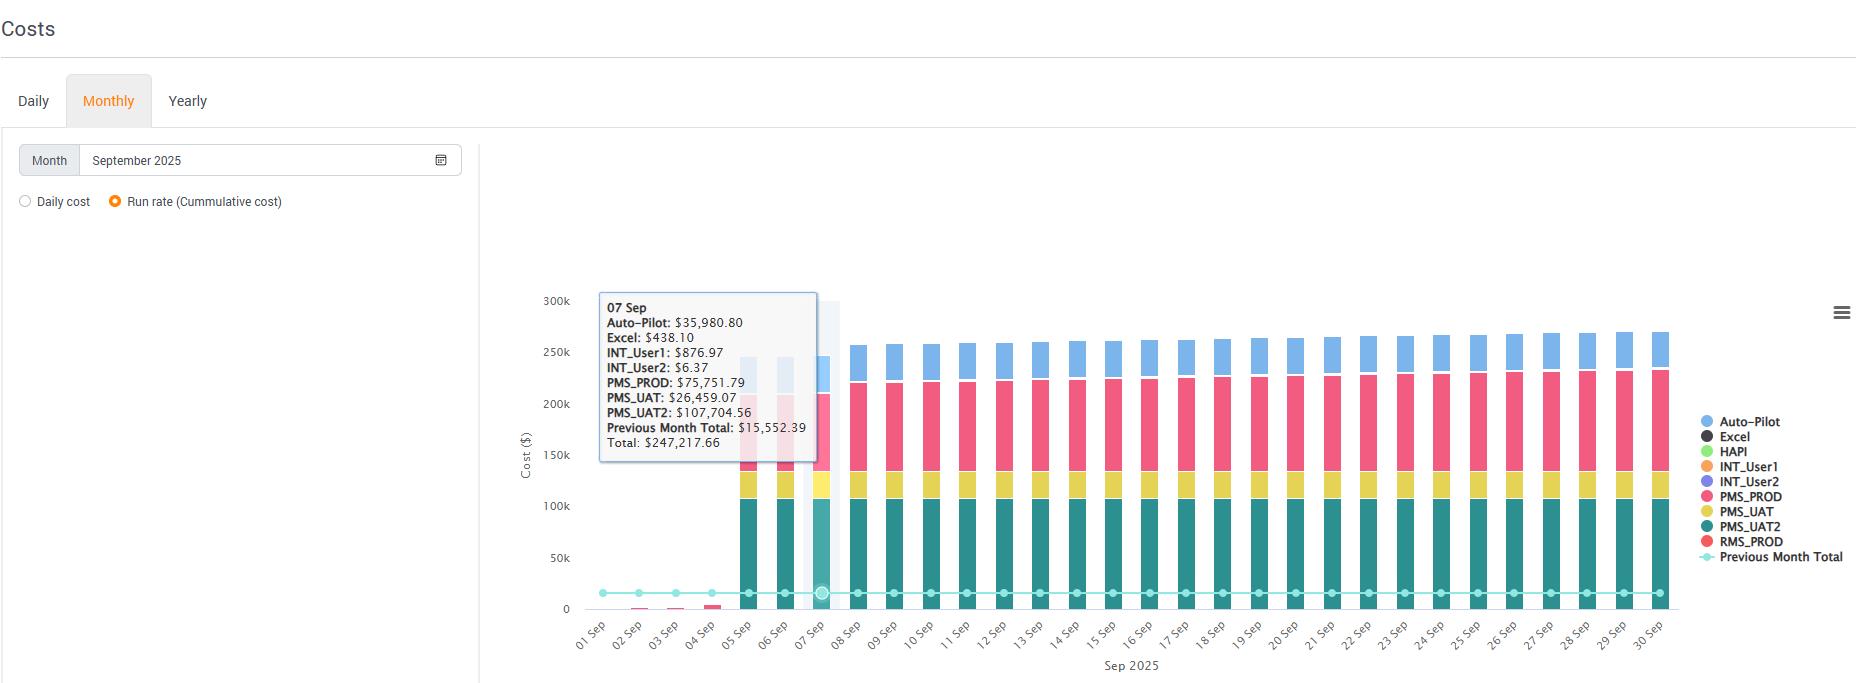
Monthly Running Cost is based on request data using Pay As You Go pricing model and offers a cost allocation per system:
Complementing the Monthly Running Cost is the Heatmap Scheduled Pricing, simulating the and pricing model:
A new dashboard can easily be created by clicking on the

How to create a New Tile:
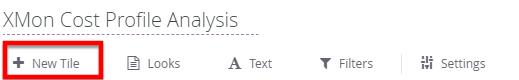
In order to create a new graph tap  . You will then see a different range of reports. In order to create an Xmon Cost Profile you need to select the User Report Cost Analysis.
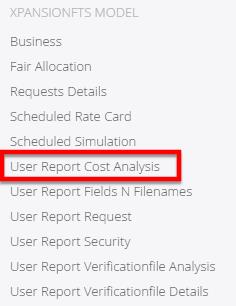
Main Xmon Data Model to use
●Use ‘User Report Cost Analysis’ to create tiles on Xmon cost estimates based on all requests monitored.
●Use ‘User Report Fields N Filenames’ to create tiles on requests filenames or fields used in all requests monitored in Xmon
●Use ‘User Report Detailed Itemised Invoice Analysis’ to create tiles based on Detailed itemised invoice cost rebuilt
●Use ‘User Report Detailed Itemised Invoice Details’ to create tiles based on Detailed Itemised Invoice filename analysis
Then you can easily set a title and click on dimensions and measures to select them from your report. Also, users can visualise the report by choosing from a variety of different tables, graphs and colours. Applying a FILTER for specific dates will produce more customized results.
3.5Download Standard Reports
Xmon's comprehensive reporting suite provides on-demand access to detailed analytics and operational insights. Navigate to Reports > Standard Reports to generate and download any report instantly.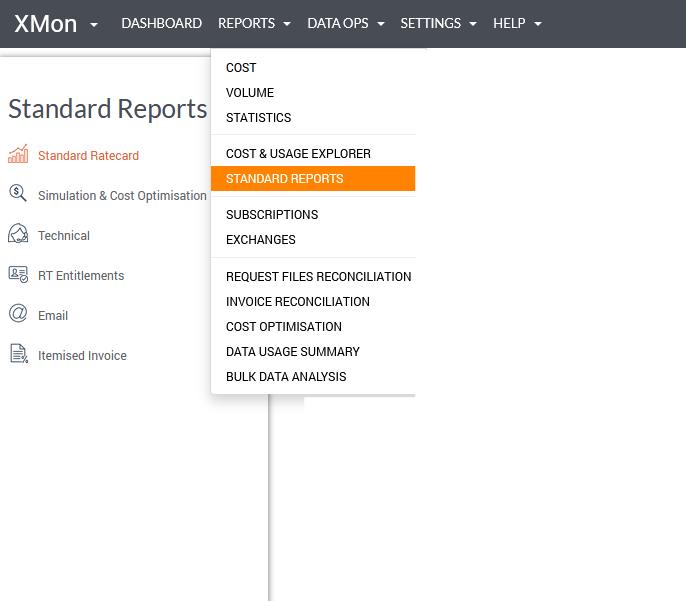
3.5.1Request Level Analysis Reports:
[STD-01] – Monthly Report by Source
This report provides a breakdown of the monthly cost and volume by Data Category, by system and by day per Data Source.
[STD-03] – Requests by Date
This report provides comprehensive details of the requests submitted in the given date range. It provides details including request name, type, the Data Source, system, Data Categories, Security Type, count of securities and the timestamp.
[STD-06] – Monthly Invoice
This report provides a breakdown of the monthly cost for the selected Data Contract by Security Type, by Data Category and by individual internal system.
[STD-07] – Monthly by System
This report provides a breakdown of the monthly cost and volume by Data Category, and by day per system (Data Connector).
[STD-09] – Monthly by contract
This report provides a breakdown of the monthly cost and volume by Data Category, by system and by day per Data Contract.
[STD-12] – Detailed fair cost allocation
This report shows the detailed consumption of data by individual Security and Data Category for a specified Data Contract and month. This output can be used to compute a fair allocation of the monthly cost between systems within the same data contract.
Once generated, the report will be available for you to download in the Notifications section in the top right corner.
[STD-13] – Detailed securities and fields
This report provides a detailed breakdown of fields requested per security, as well as the full list of request files name for a specified data contract and month. This output can be used alongside the STD12 report to provide visibility of securities and fields requested per system.
Once generated, the report will be available for you to download in the Notifications section in the top right corner.
[STD-17] – Compare Historical Category Subscription
This report compares the securities requested month over month, allowing you to identify which ones are at risk of “losing” their historical data subscription this month. If these securities are requested again next month, they will incur an Initial Cost rather than a Maintenance Cost.
[STD-23] – BVal Monthly Invoice
This report provides a breakdown of the monthly cost for the selected Data Contract by BVal type, by snapshot and by individual internal system.
[STD-32] – Average Daily Usage by System
This report computes daily usage average per system over the selected months. This report is useful to help you define rules on daily usage limit per system and catch issues when systems/environments start to overconsume data. This pro-active measure helps mitigating potential spikes in Multi-hit cost.
[STD-32] – Average Daily Usage by System
This report allows you to search for specific fields across your data contract within a selected month. Simply input your target fields to identify which systems are consuming them. Particularly valuable for tracking usage of third-party licensed content (such as rating agency data), this tool helps you monitor and manage specific field consumption across your organisation.
3.5.2Simulation & Cost Optimisation Reports:
[STD-14] – Data usage analysis
This report provides a detailed cost analysis of redundant requests, as well as a breakdown of cost by fields and category, which could be used as part of an ROI analysis of a Data Caching installation.
[STD-18] – Scheduled Mode Cost Estimate
This report is computing an estimated monthly cost of your data consumption under the 'Scheduled' Contract type. Please select a 4 month period for the best accuracy of estimates. It shows and compares the monthly running cost between a ‘Scheduled’ mode versus a ‘Per Security’ mode.
[STD-24] – Securities Discontinued From Download
This export generates a .csv file listing the securities and categories that stopped being downloaded as of the specified month (i.e., the last month in which they were downloaded). It is used in the Scheduled pricing model to forecast the number of unique securities that have dropped off when moving into the next four-month period
[STD-29] – Benchmark Report
This report shows your cost profile compared to that of other financial institutions using Xmon with similar characteristics. Xmon calculates benchmark analytics based on comparable Investment Types, Assets Under Management, and Employee Count.
3.5.3Technical Reports:
[STD-02] – Rejected Requests
This report provides a summary of the limits as well as the list of rejected and timed out requests for the selected monthly period.
[STD-05] – Monthly Error
This report lists all the requests that have not been processed fully within the system for the selected month. The aim of this report is to identify any processing error, message formatting mistake or other incorrect system configuration.
[STD-16] – Unknown Securities
This report shows a list of all Securities ID requested for a specified month, which is not in the OpenFIGI reference library.
[STD-33] – Request Files Export
This report provides an archive with all the request files that have been processed by Xmon for a given reporting month and given data source.
3.5.4RT Entitlements Reports:
[STD-11] – Monthly RT subscriptions
This report is defined by the Real-Time Contract and displays Exchange Subscription costs and Fixed costs, along with several breakdowns of these analytics by Top 5 Spenders, Business Line, Region, and Role.
[STD-20] – Report Settings
This report exports the latest RT Subscriptions or Exchanges entitlements in a .csv format for all End Users and the cost associated.
3.5.5Itemised Invoice (Verification Files) Reports:
[STD-25] – Securities in both Adhoc & Scheduled
This report exports the list of security IDs which have been requested in both Adhoc and Scheduled modes and could show a significant savings if duplicates are mitigated.
Once generated, the report is ready to be downloaded in the Notifications section in the top right corner.
[STD-26] – Securities with multiple BVAL snapshots
This report exports the list of security IDs for which multiple BVAL Snapshots have been requested. Reducing the number of distinct snapshots will reduce the monthly cost of the BVAL Service.
Once generated, the report will be available for you to download in the Notifications section in the top right corner.
[STD-30] – Detailed Itemised Report by SecurityID
This report exports all Security IDs included in the detailed itemised invoice for the selected month, across all requests made during that period. You can use for more granular, security-level analysis. Note: Generation may take some time.
Once generated, the report will be available for you to download in the Notifications section in the top right corner.
[STD-31] – Detailed Itemised Report by Filename
This report exports all Response Files included in the detailed itemised invoice for the selected month and provides metrics on Security Count and Multi-hit Count contributions. It supports deeper, request-level analysis to identify repeated requests. Note: Generation may take some time.
Once generated, the report will be available for you to download in the Notifications section in the top right corner.
[STD-35] – Search for SecurityID usage across accounts
This report allows you to enter a list of Security IDs and search all Data Sources for a given month to verify whether those securities are downloaded. It also extracts the filenames that contain these securities. This is a valuable tool for monitoring security usage, particularly when it may trigger third-party licensing fees separate from the vendor that redistributes the data (e.g. price broker data).
Once generated, the report will be available for you to download in the Notifications section in the top right corner.
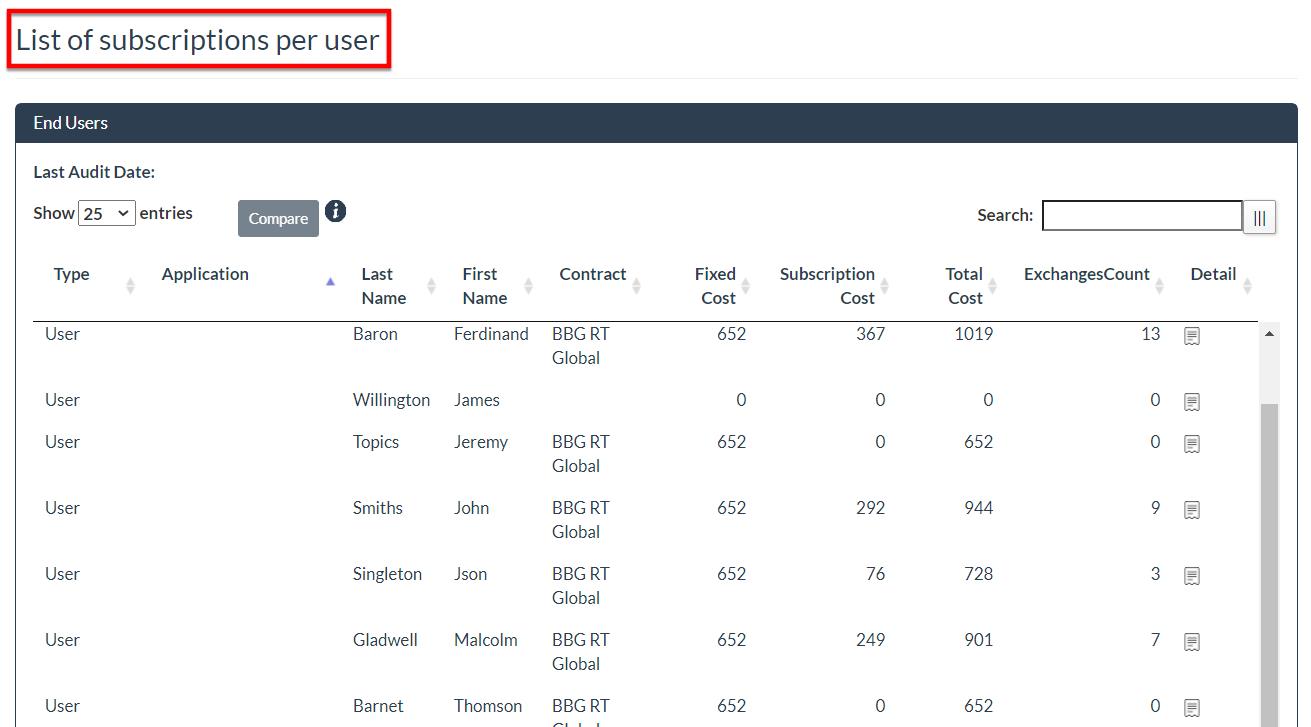
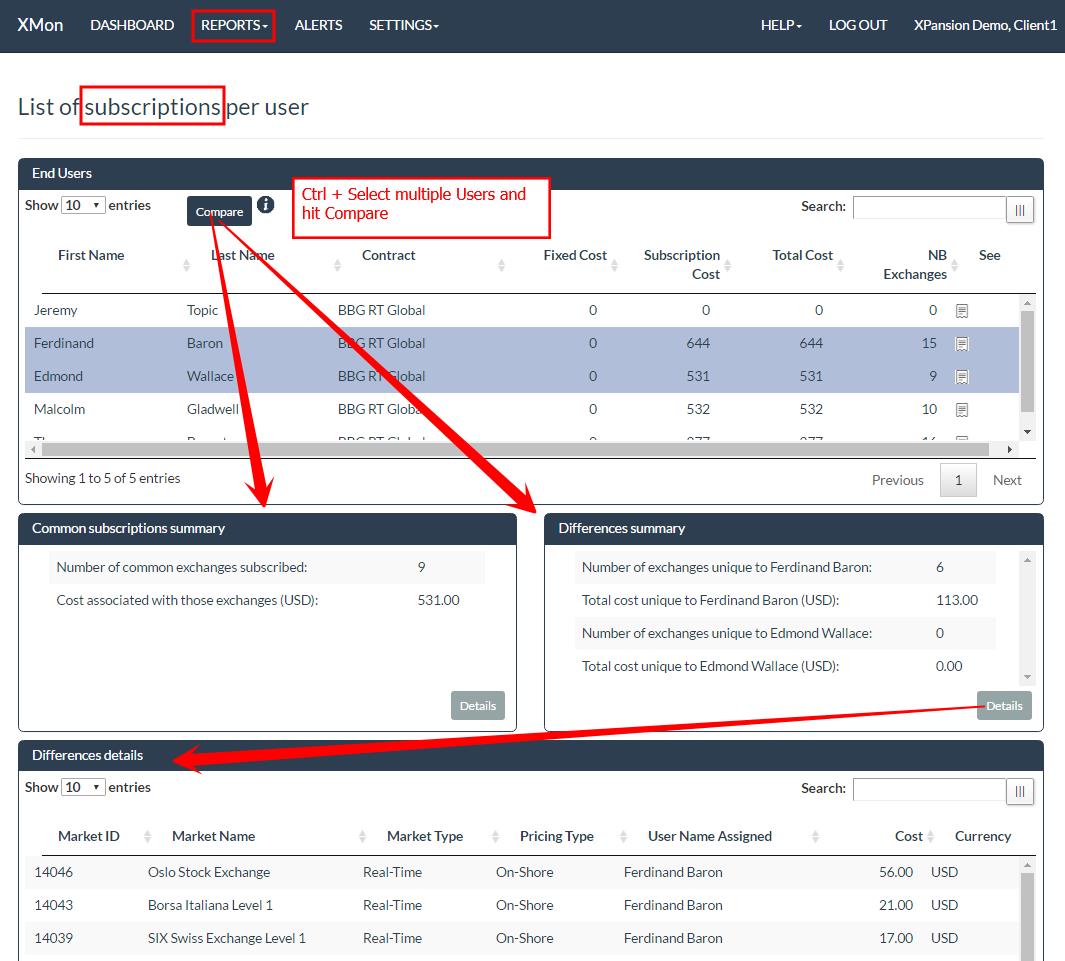
3.6RT Exchange Subscription Cost – Report by End User
A report of cost summary by the end user can be viewed in the menu ‘REPORTS’ > ‘SUBSCRIPTIONS’.
It will display the list of all End Users defined and assigned to a Real-Time type of data contract. Along with the attributes of the end user the report will display its fixed cost contribution and its specific exchange subscriptions cost.
Fixed Cost:
Fixed cost per end user is calculated as the sum of all fixed costs of type ‘per user’, plus the sum of all fixed costs of type ‘per contract’ divided by the total number of end users assigned to the same Real-Time data contract.
Subscription cost:
A detailed list of exchange costs can be displayed on the right-hand side of the list by clicking on the ‘Detail’ icon as shown below. The ‘As Of’ field allows you to view the audit of its previous consumption of exchange subscriptions.
This is possible to compare Subscriptions between multiple users and identify in 1 click their differences of subscriptions. Simply hold ‘Ctrl’ and select multiple users, then hit ‘Compare’ and use ‘Details’ button to show the list of exchanges in common or differences.
3.7RT Exchange Subscription Cost – Detailed Report
The report accessed through the menu ‘REPORTS’ > ‘EXCHANGES’ displays the sum of subscription costs across all End Users in the list of exchange by exchange.
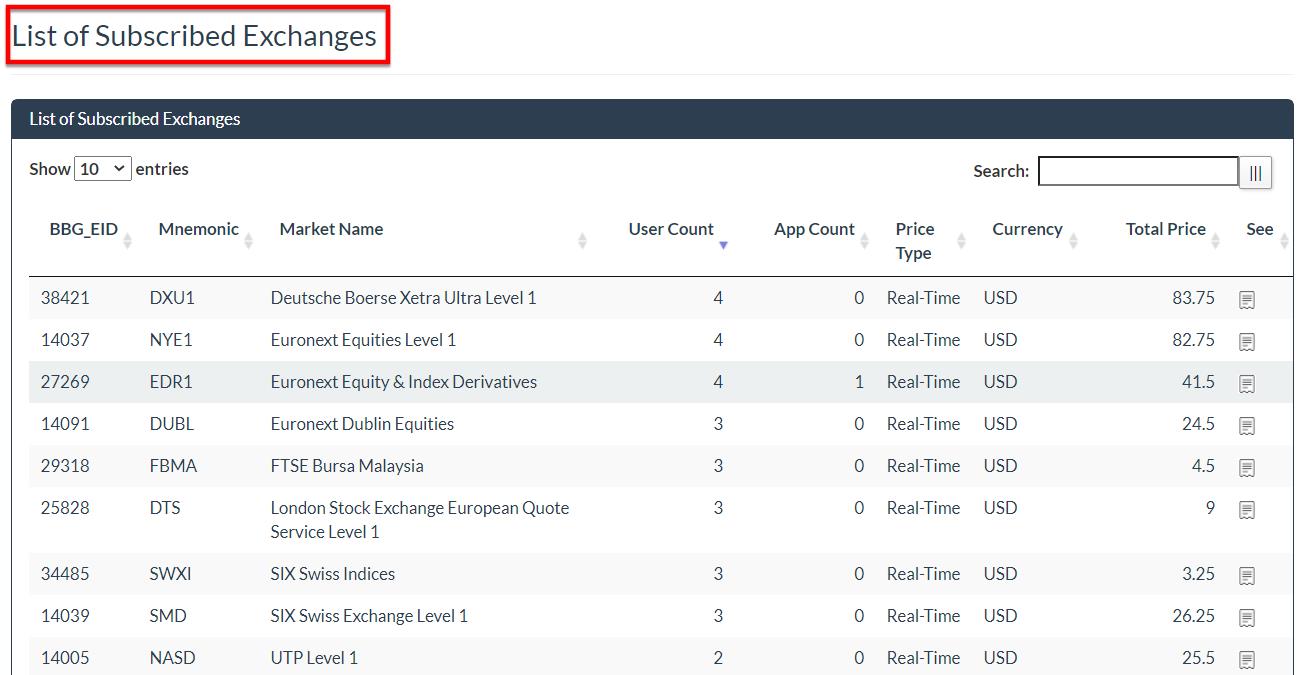
If two end users are subscribing to ‘Vienna Stock exchange’, which has an individual subscription cost of USD 66.00, the line for this exchange will display USD 132.
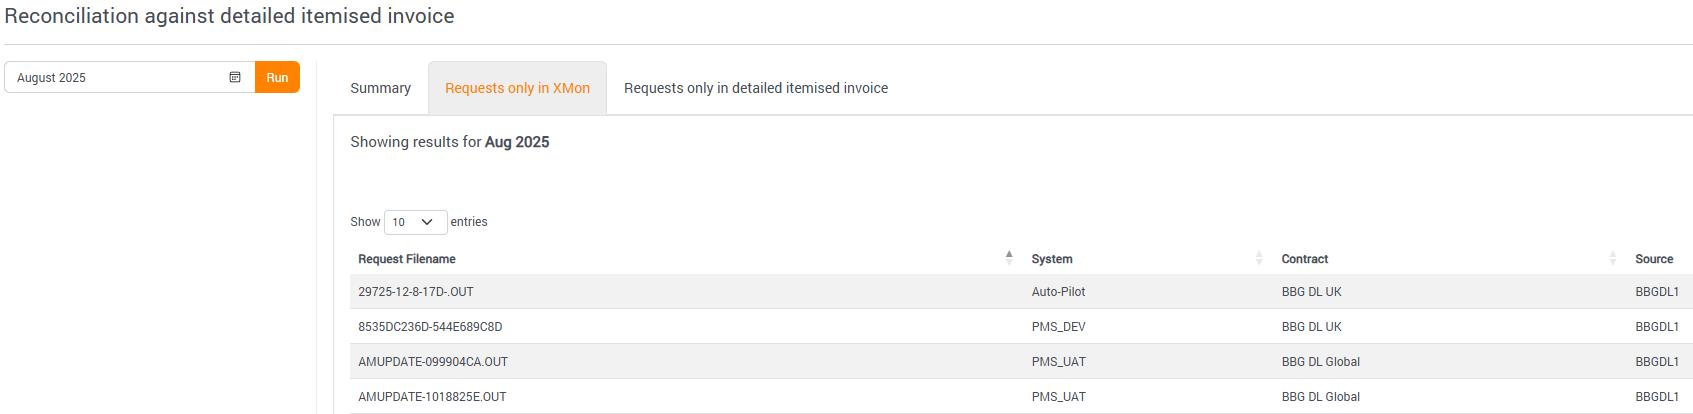
3.8Request Files Reconciliation
Once the monthly Detailed itemised invoice has been uploaded in the menu ‘DATA OPS’> ‘IMPORT DATA’ > ‘DETAILED ITEMISED INVOICE’ and it has been processed overnight, a report will show the reconciliation of request files processed in Xmon versus the file processed by the data vendor for the selected month.
To view the report, go to the menu: REPORTS > REQUEST FILES RECONCILIATION, select the applicable month and click the ‘Run’ button
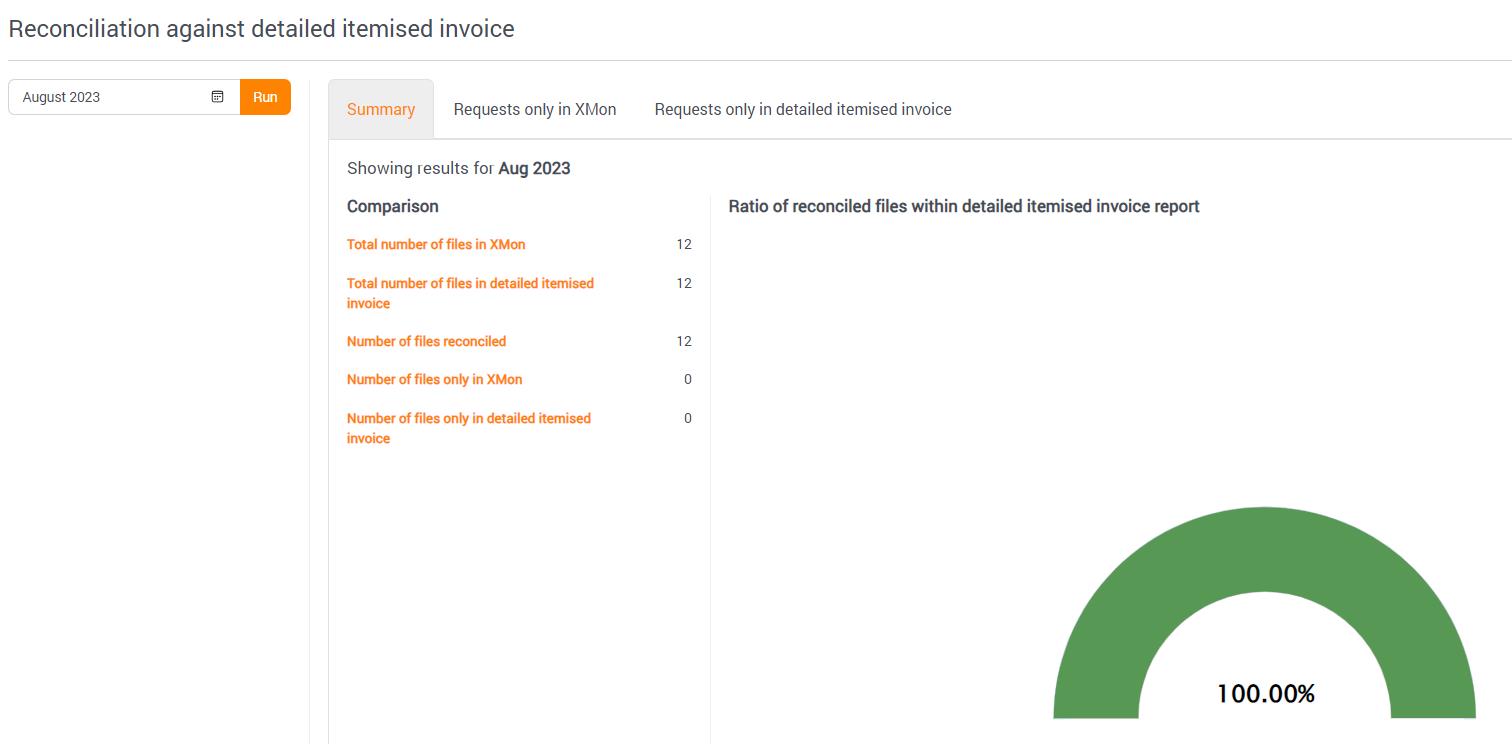
Select the ‘Requests only in Xmon’ tab to view requests not present in the Detailed itemised invoice or ‘Requests only in detailed itemised invoice’ for the files processed by the data vendor but not processed successfully in Xmon.
This report allows you to validate that all of your systems are connected to Xmon and is monitoring your whole environment. It will also show the requests which have passed through Xmon but have not been processed by the data vendor.

3.9Invoice Reconciliation Report
Invoice reconciliation provides the user the opportunity to compare and analyse Bloomberg's invoice with Xmon’s estimates by highlighting any differences for the selected month. In order to use this function, you need to make sure that you’ve uploaded the invoice (Please refer to How to upload the Bloomberg Invoice). Once invoice .csv file has been uploaded the Invoice Reconciliation report can be easily found under the menu REPORTS > INVOICE RECONCILIATION.
The Details tab will help you analyse the costs and spot any differences.

3.10 Cost Optimisation
You'll find the Cost Optimisation feature in REPORTS > COST OPTIMISATION. This smart analysis tool looks at your market data usage and spending to give you automated recommendations based on your requests integrated in Xmon. It scans your consumption patterns and creates a clear summary of practical insights, showing you exactly how much you could save with each one. The current month's analysis shows your total potential savings up front, with everything organised by impact - so you can easily spot and tackle the biggest opportunities first.
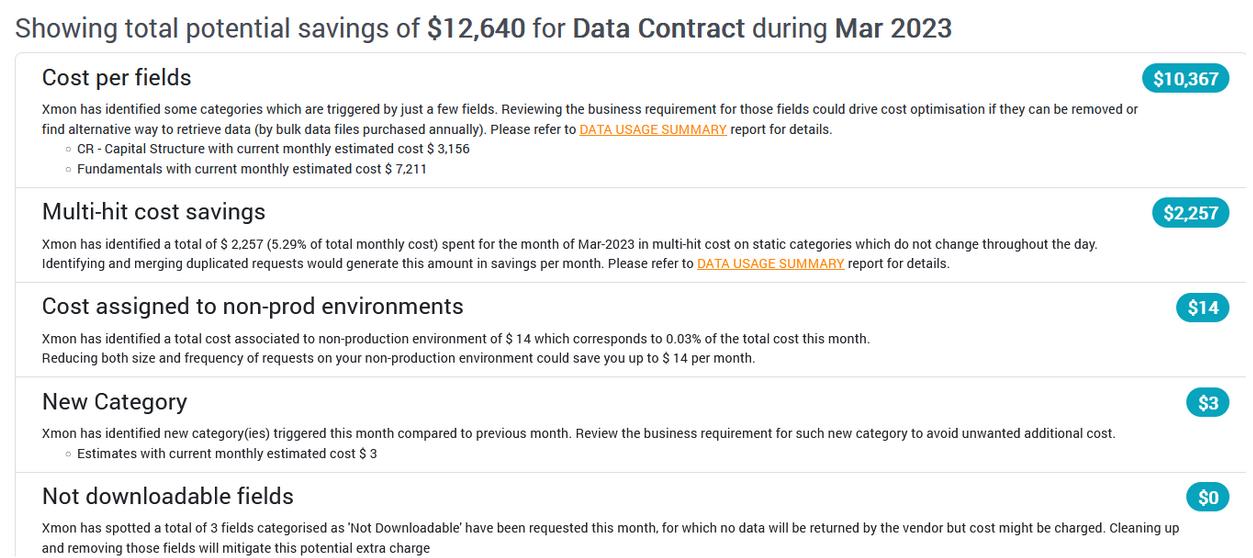
Click the DATA USAGE SUMMARY link to access deeper analytics at both field and request levels – see the next section for more details.
3.11 Data Usage Summary
This Data Usage summary page is designed to view a summary of potential areas of savings that can be pointed out by Xmon Reporting. Each scenario is represented as a tab so the user can focus onto the area of savings that is most pertinent to him.
3.7.1Request Analysis
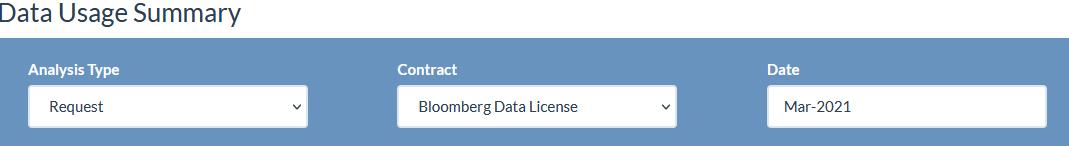
The Data Usage Summary can be found under the REPORTS section. REPORTS> DATA USAGE SUMMARY. In order to proceed with the analysis, you need to select ‘Requests Analysis’/ ‘Itemised Invoice Analysis’, the CONTRACT and the Date.
3.7.2Repeat Costs
In this section you will be able to see the cost of instruments requested multiple times per day based on the Contract and the date by choosing the type of Analysis, contract and date. In the graph you will be able to see. It makes it clear in which data categories we need to focus effort of analysis in order to make significant savings on the repeat cost.

3.7.3Multi Hit Analysis
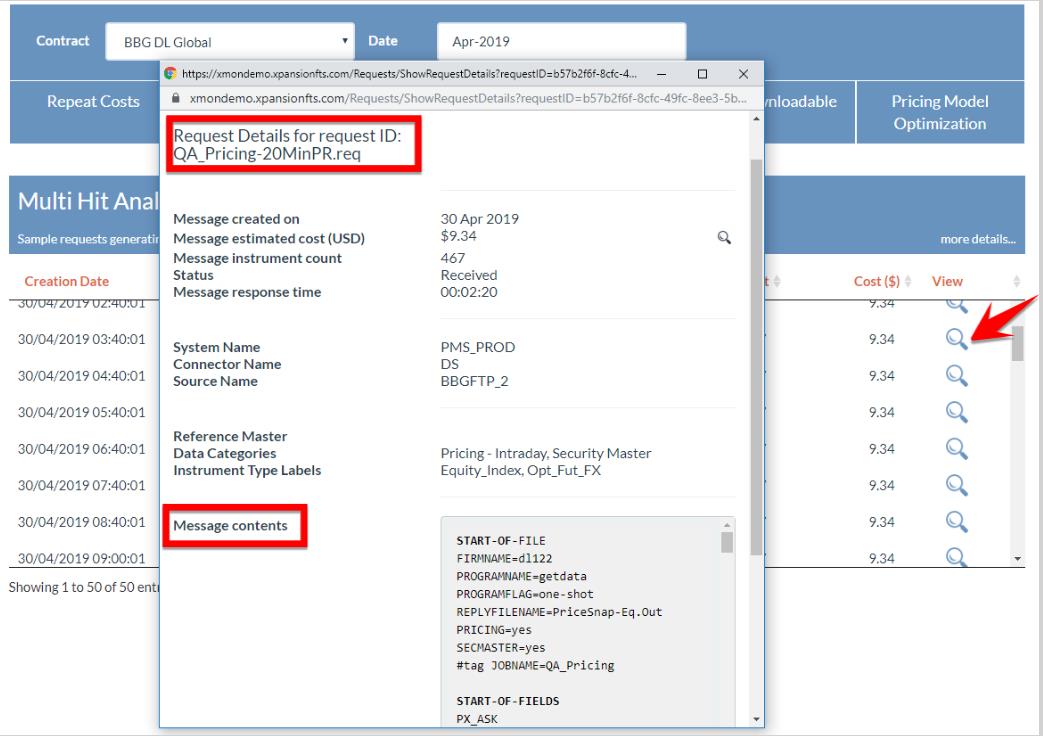
Multi-Hit Analysis gives a detail of requests that generate ‘repeat cost’ for a given category (requested multiple times per day). The user is able to find out the requests for a selected category and the exact date/time that were executed. Users can then drill down to the individual request details by clicking on the ‘View’ magnifying glass button.
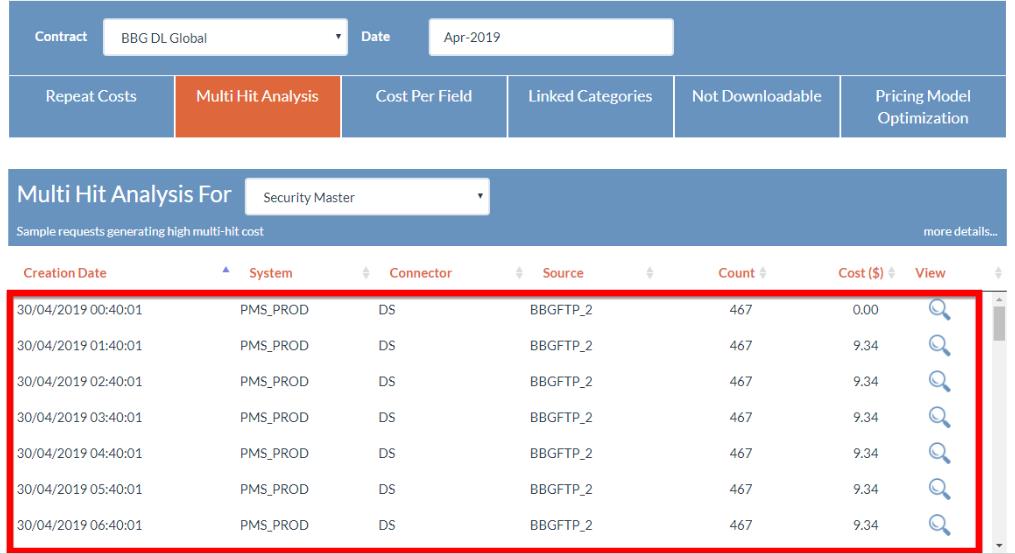
By clicking in the magnifying glass, you will be able to view the requested details and the content for the request.
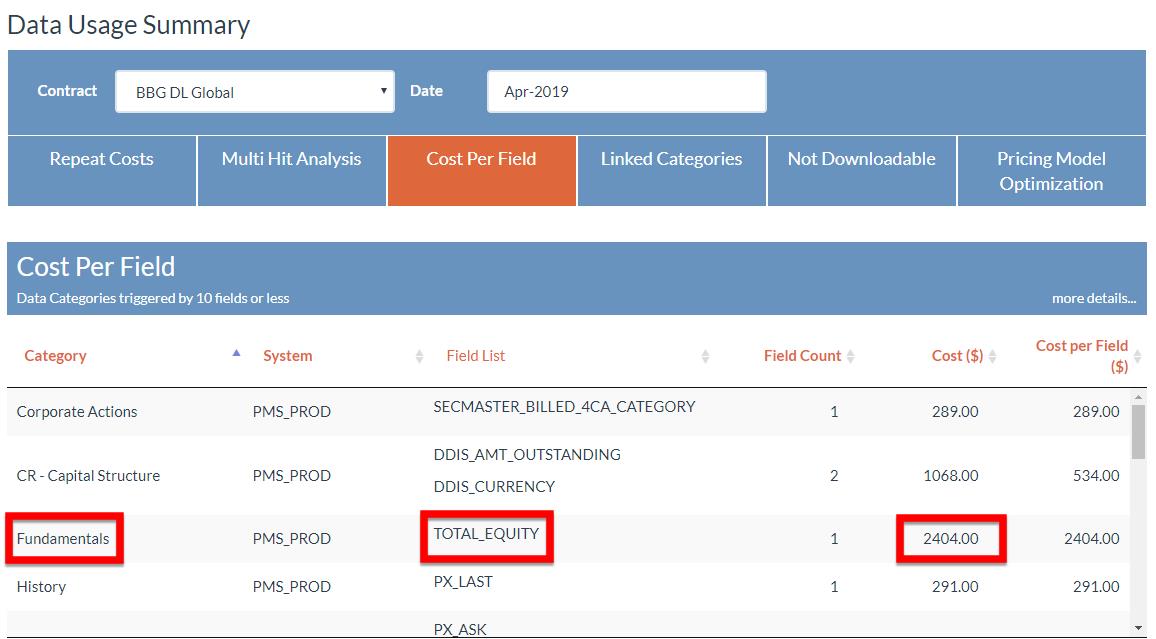
3.7.4Cost Per Field
This scenario focuses on data categories that are triggered by 10 fields or less. It empowers users to see categories with high cost but triggered by only a few fields. If those fields are removed from requests it will generate a saving equivalent to the shown estimated cost ($).
3.7.5Linked Categories
The Linked Categories shows the sub-categories that have been requested for security ID but the Parent category has not been requested. You will still be charged for the parent category.
Example: Corporate Actions is a sub-category of Security Master. Security Master will be billed even if no Security Master field has been requested but only Corporate Action.

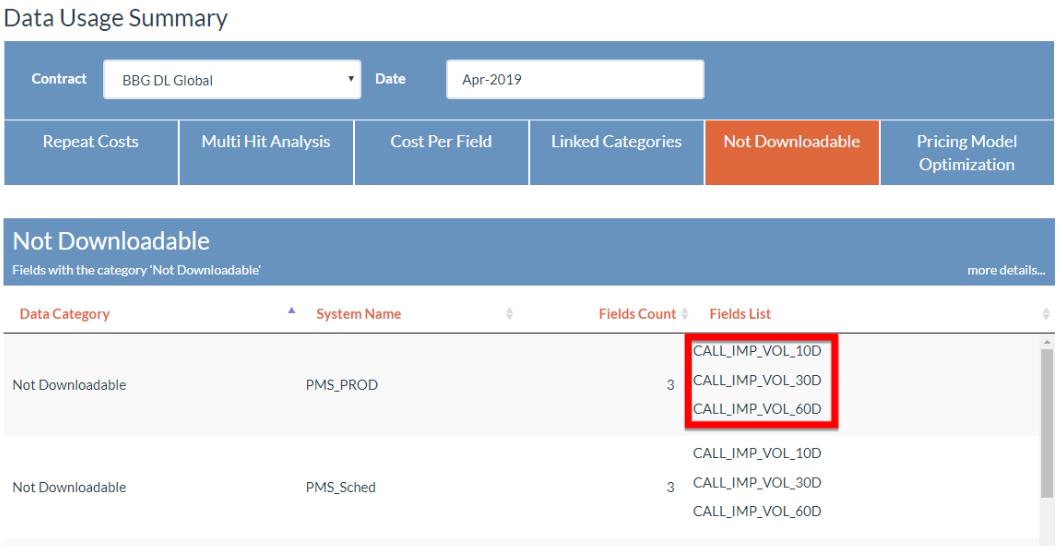
3.7.6Not Downloadable
This section shows fields classified as ‘Not downloadable’ by the data provider. So, no data will be returned however the billing category might still be charged.
This is a good practice to remove any ‘Not Downloadable’ field from your requests to avoid such over-charge.
3.7.7Pricing Model Optimization
The purpose of the Pricing Model Optimization section is to demonstrate how much the client could save by switching from Per Security to Scheduled request. Fair estimation of total cost for each category and potential savings if the client switches to another category. The table is split up by the Data Category, Asset Type, the Total Scheduled Cost, the Total Per Security Cost, the difference in percentage and also the unique count. This could save a decent amount to the client and reduce its cost.
More details on the simulation scenario can be found in the [STD-18] – Scheduled Mode Cost Estimate

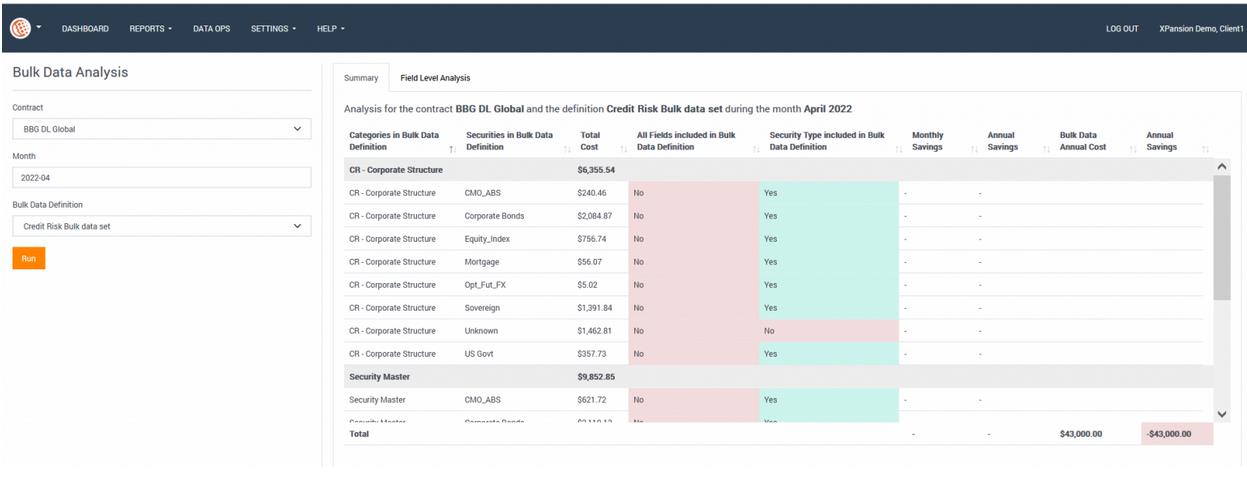
3.12 Bulk Data Analysis
Xmon is now able to define vendor bulk data files and run cost simulation based on all requests monitored in Xmon for a given month. This will help answer the question whether bulk data purchase is more cost effective compared to data purchased using ad-hoc models. If you do have a bulk file subscription, Xmon will indicate whether it makes sense to keep it. Setting up this two-step simulation in Xmon is very simple.
First, create a definition of the bulk file, which includes the annual cost and data available in that file:
Second, run the analysis for a selected month. The results will be displayed in a summary table:
4 Data Operations
The DATA OPS menu is a new feature that has been created in order to help in the administration of the data that is monitored by Xmon.
4.1Search
The SEARCH menu can be found in the ‘DATA OPS ‘> ‘SEARCH’
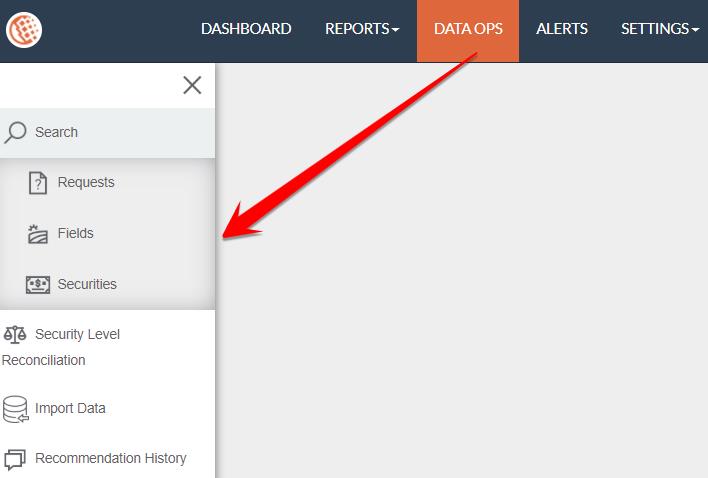
The search engine enables users to retrieve any requests monitored by Xmon in the path and also enable them to enrich the Tags or to exclude requests from Pricing after seeing in the DETAILED ITEMISED INVOICE if some of the request files haven't been processed by Bloomberg. Hence it gives the opportunity to carefully look through requests, fields and securities.
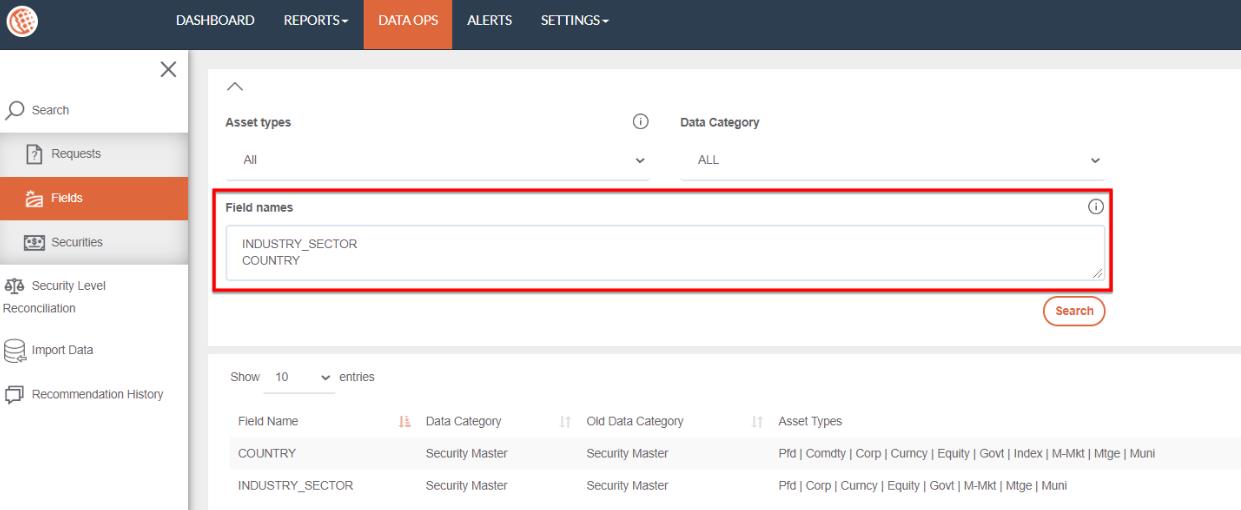
4.1.1Bloomberg Fields
The Bloomberg Field is an electronic dictionary of Bloomberg providers. The engine searches for their meaning and identifies these items in the databases by providing information like the Field name, Data Category, Asset Type, Description etc. A user can search using the field names and then click on the SEARCH bottom.
Copy-paste list of fields (separated by; or return carriage)
This search engine will investigate for the fields equal to the values given. Use * as a wildcard. This acts as ‘any text’. For example, ‘PX*’ will return all fields beginning with ‘PX’ and ‘*PX’ will return fields ending with ‘PX’
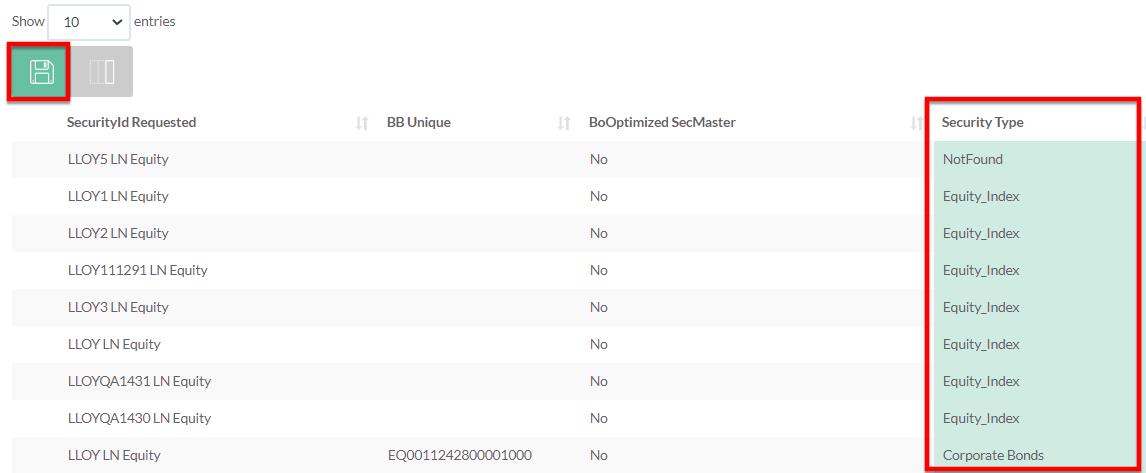
4.1.2Securities
The SECURITIES engine allows the user to search for content in regards to a particular security via keywords. To perform a search, you’ll need to navigate to the search engine below and type the Security Id or key phrases – then press SEARCH. Once the search is completed, a detailed list will appear and match the inquiry. For example, the LLOY LN Equity validates the security type which is Equity Index, the BB Unique and the source which is the DETAILED INVOICE.
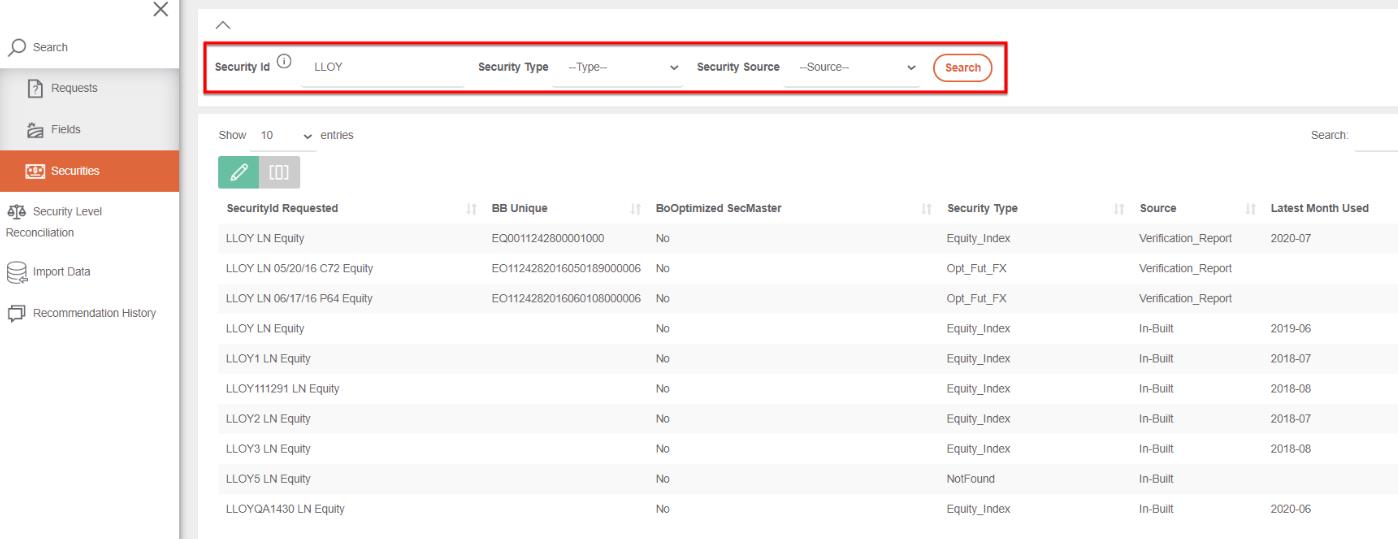
In case user wants to edit the Security Type column can tap on the  and adjust it accordingly.
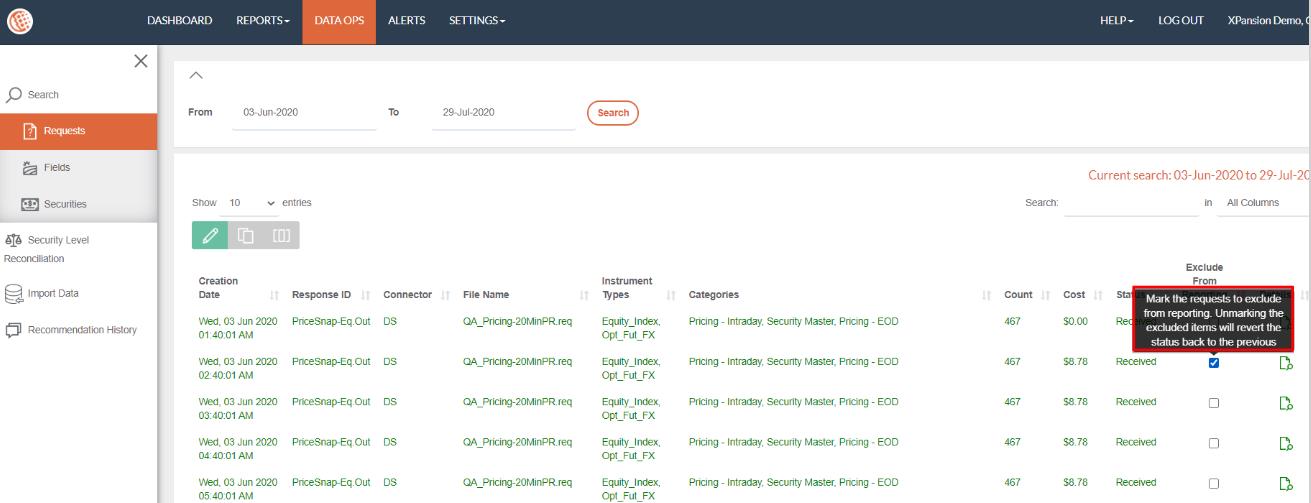
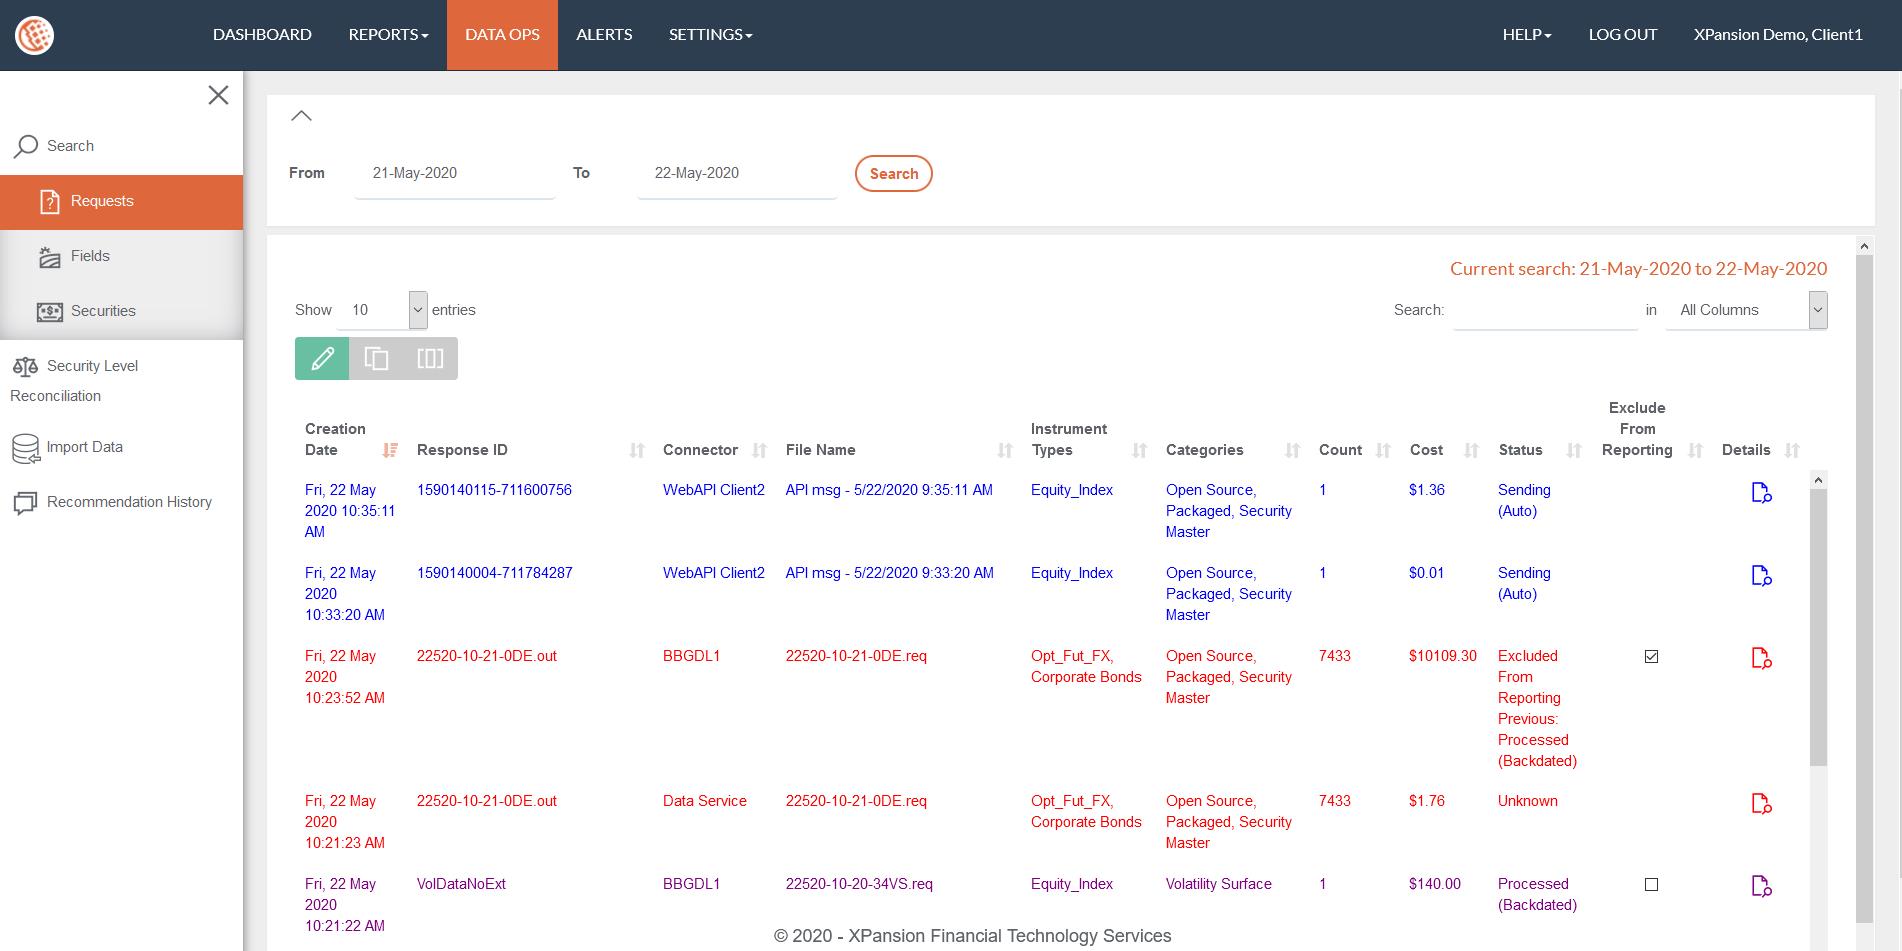
4.1.3Requests
Under the REQUESTS section the user is able to analyse a broader range of requests for a longer period of time. By selecting the dates and clicking SEARCH you’ll be able to check information like the creation date, the Response ID, the Connector, the File name, Categories etc. Users are also able to see the request in the dashboard but up to 8 weeks.
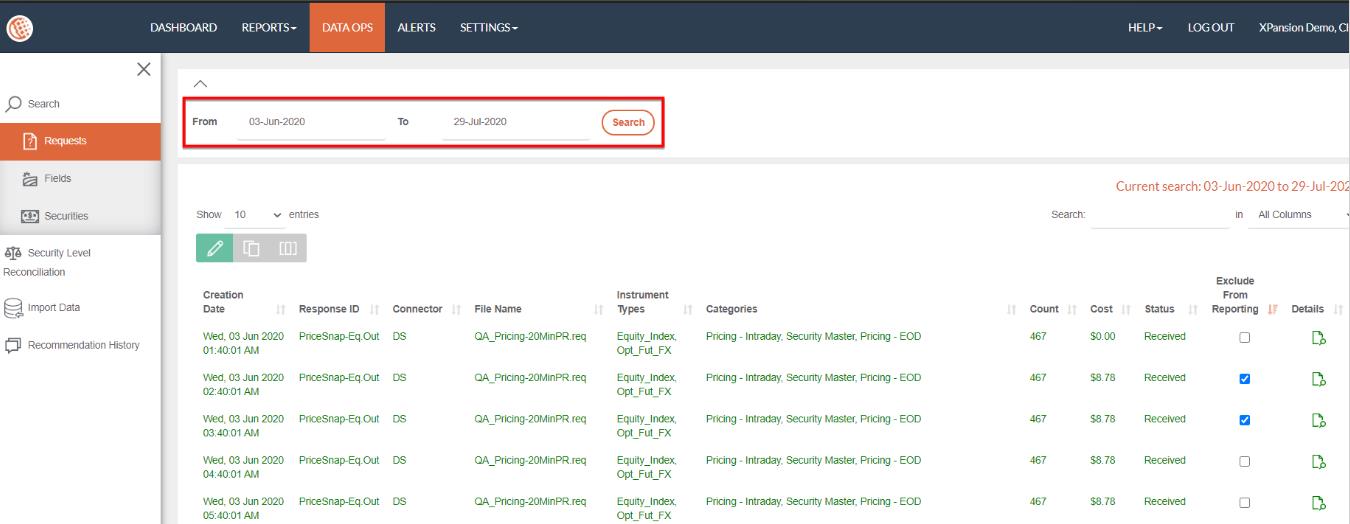
The user has the opportunity to edit the editable columns  and mark the requests to exclude them from reporting. Unmarking the excluded items will revert the status back to previous.
4.2Security Level Reconciliation
The security level reconciliation helps the user see the details of each security based on the contract, date and the status. It can be found under the ‘DATA OPS’ > ‘SECURITY LEVEL RECONCILIATION’.
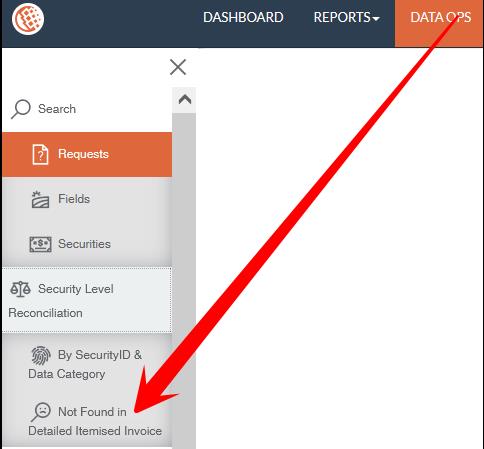
Security Level Reconciliation is compromised by two sub-categories. By SecurityID & Data Category and the Not Found in Detailed Itemised Invoice.
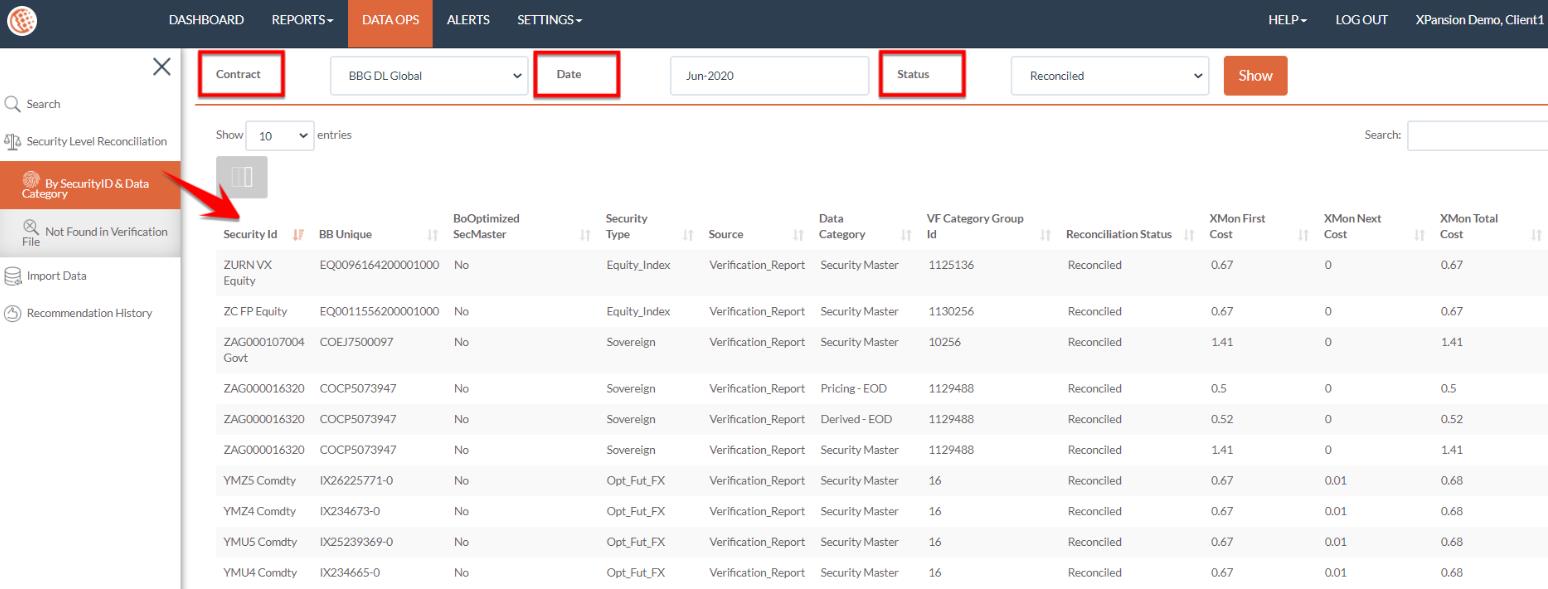
4.2.1By SecurityID & Data Category
There are three choices for Status: Reconciled, Only in Detailed invoice and Only in Xmon. Once you select the first category “Reconciled” you’ll be able to see all the securities that are matching with a Data partner from different data categories. It provides information like the Security Type, Source, Data Category and the costs. The second choice Only in Verification File shows the constituent level data that are within the Verification file but not in the Xmon. Finally, the third choice Only in Xmon indicates the security level data that is only available in Xmon and not in Verification File.
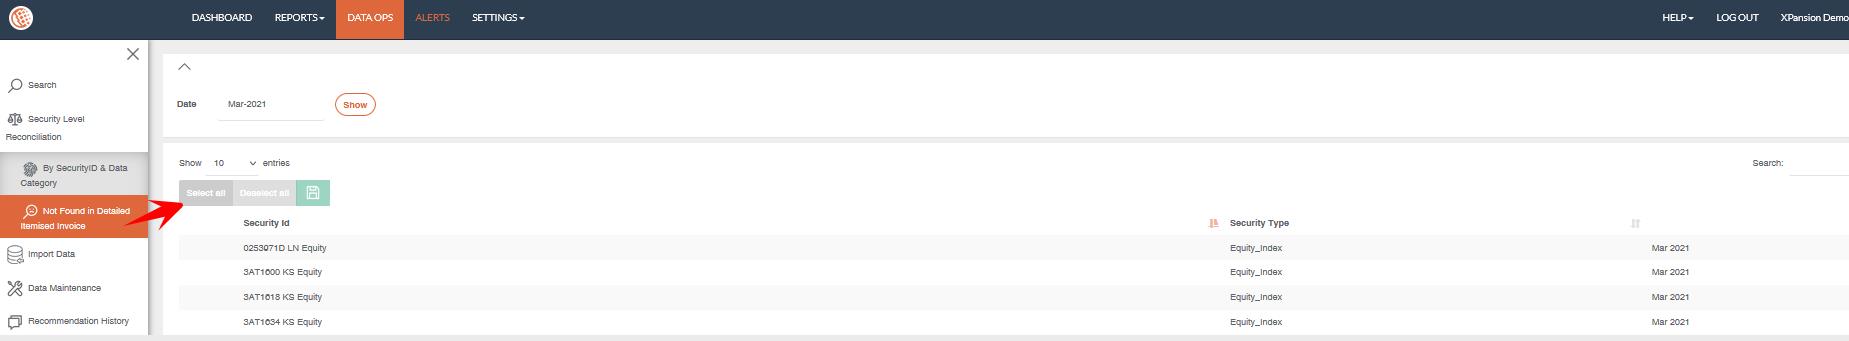
4.2.2Not Found in Detailed Itemised Invoice
Securities that Xmon couldn’t find in the Detailed Itemised Invoice are assigned as Not Found. Most of the time these are dummy or duplicate securities. The user is able to select the particular security and update it as Not Found.
4.3Import Data
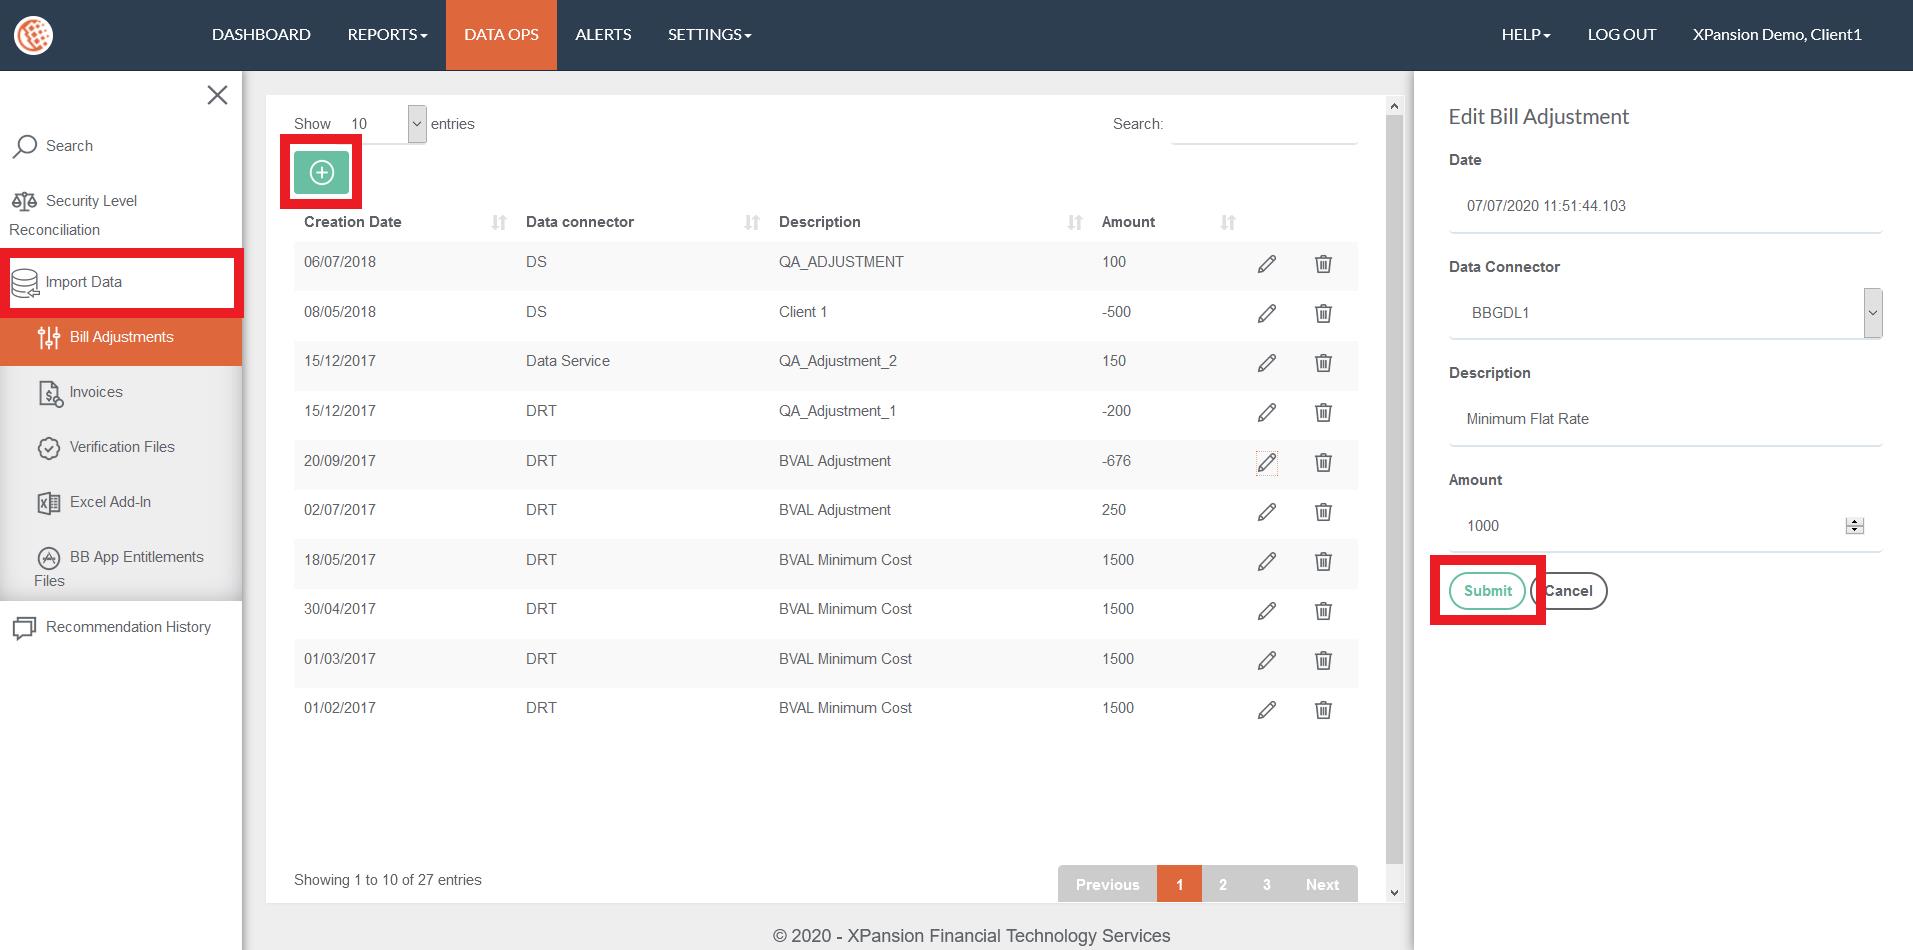
4.3.1How to define Bill Adjustment
The bill adjustment allows you to add costs shown on the data vendor invoice but not related to actual data download requests. This feature enables the client to complete the view of the vendor’s invoice for ease of comparison. A Bill adjustment will be represented in Xmon as a specific request of the amount indicated and will appear in the Dashboard with the status ‘Adjustment’ and will be taken into account into any downstream reports.
In order to define a new Bill adjustment, go to the menu ‘DATA OPS’> ‘IMPORT DATA’ > ‘BILL ADJUSTMENTS’, click on ‘Add New’ and populate the view as listed below:
- Date: input the date that you wish to see this adjustment in Xmon Reports and Dashboard monitoring.
- Data Connector: select the data connector for which the bill adjustment is related to.
- Description: Input a description for easy tracking in the dashboard and Standard Reports.
- Amount: add the amount of adjustment which can be either positive or negative in the same currency as the data contract associated with the Data Connector selected.
To Edit an existing Bill Adjustment, tap on the icon 
To remove / delete a Bill Adjustment 
4.3.2How to upload the Bloomberg Invoice
The invoice that has been provided from Data partner – (Bloomberg) should be uploaded in the Xmon environment in order to enable invoice reconciliation report. The invoice lists all the categories and security types requested and their costs in a table statement.
Once uploaded and processed, users can view the reconciliation report vs Xmon estimates in the menu ‘REPORTS’ > ‘INVOICE RECONCILIATION’. For more details refer to section Invoice Reconciliation Report.
Note: In order to ensure the smooth upload, the file should be into .CSV format with no special formatting. A good practice is to copy values of invoice tab from Bloomberg .xls and ‘paste-value-only’ into a new excel spreadsheet and save as .csv format.
To upload an invoice, navigate to the menu ‘DATA OPS’ > ‘IMPORT DATA’ > ‘INVOICES' and tap on the 
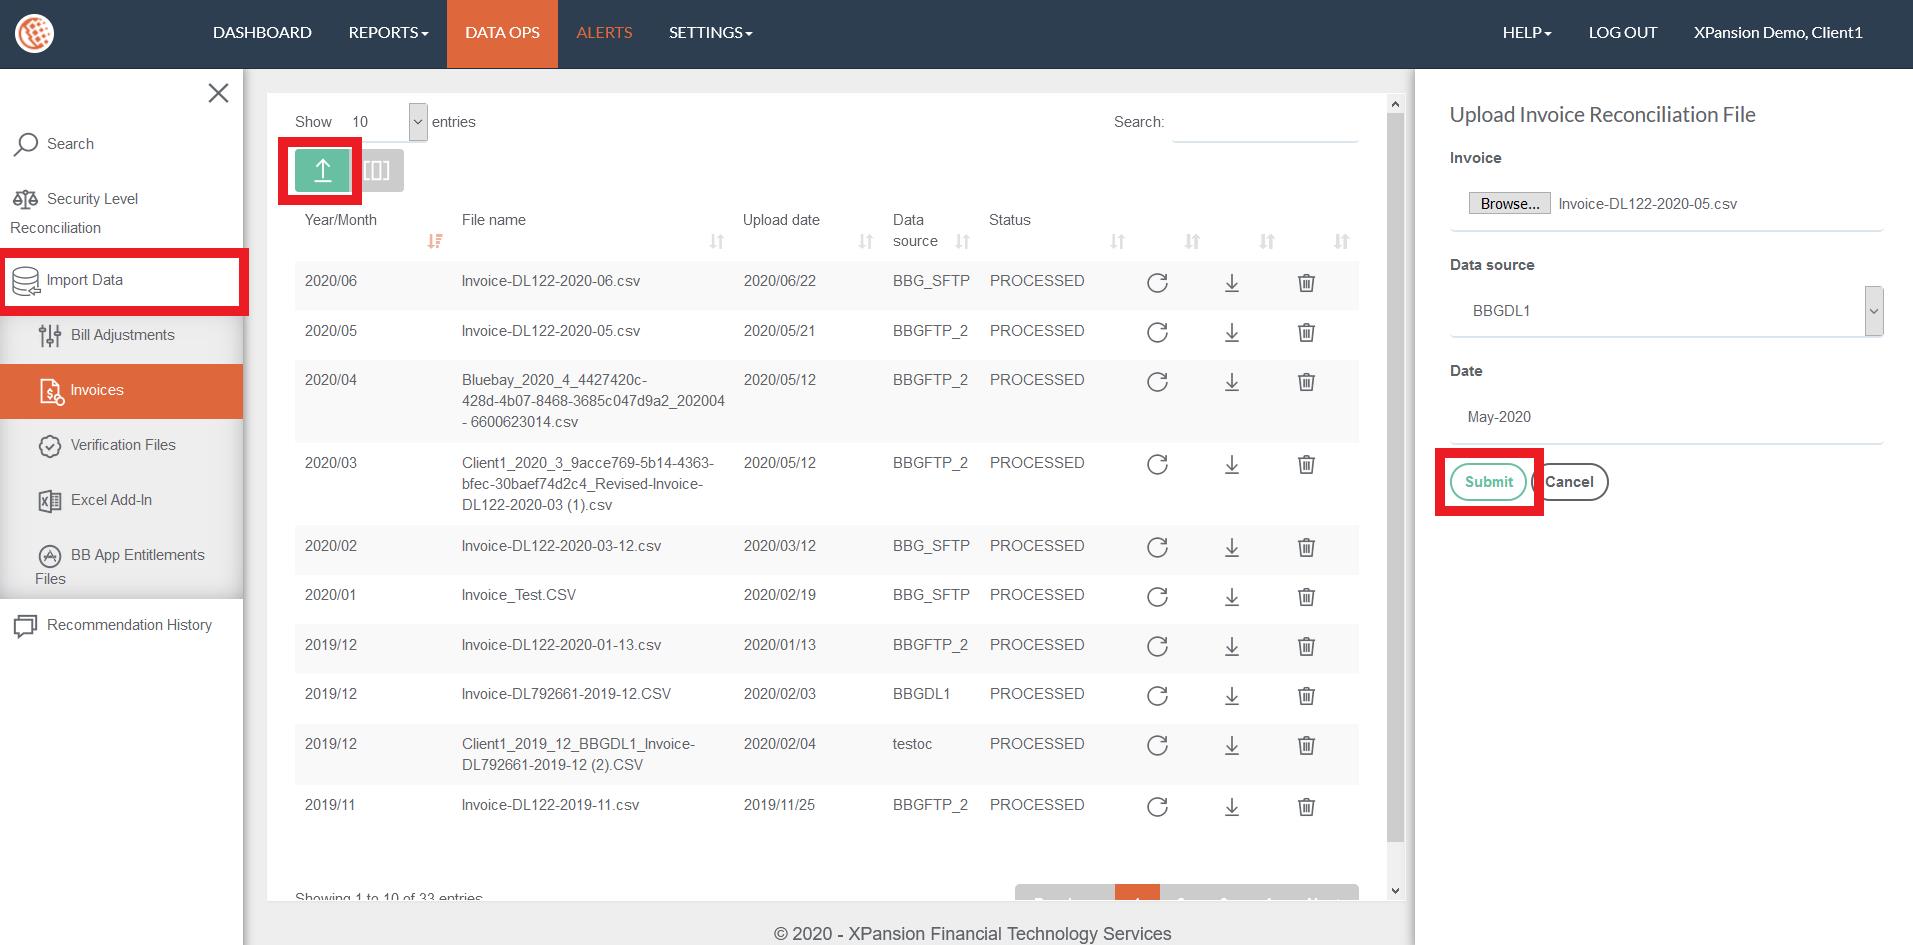
 The Replay Invoice File button: When the file status is ERROR and not PROCESSED you need to click the ‘Repeat’ button once.
 The Download Invoice File button: Allows the user to place a copy of Bloomberg invoice file.
 The Delete Invoice File button: Pressing the delete symbol allows the client to remove the current invoice.
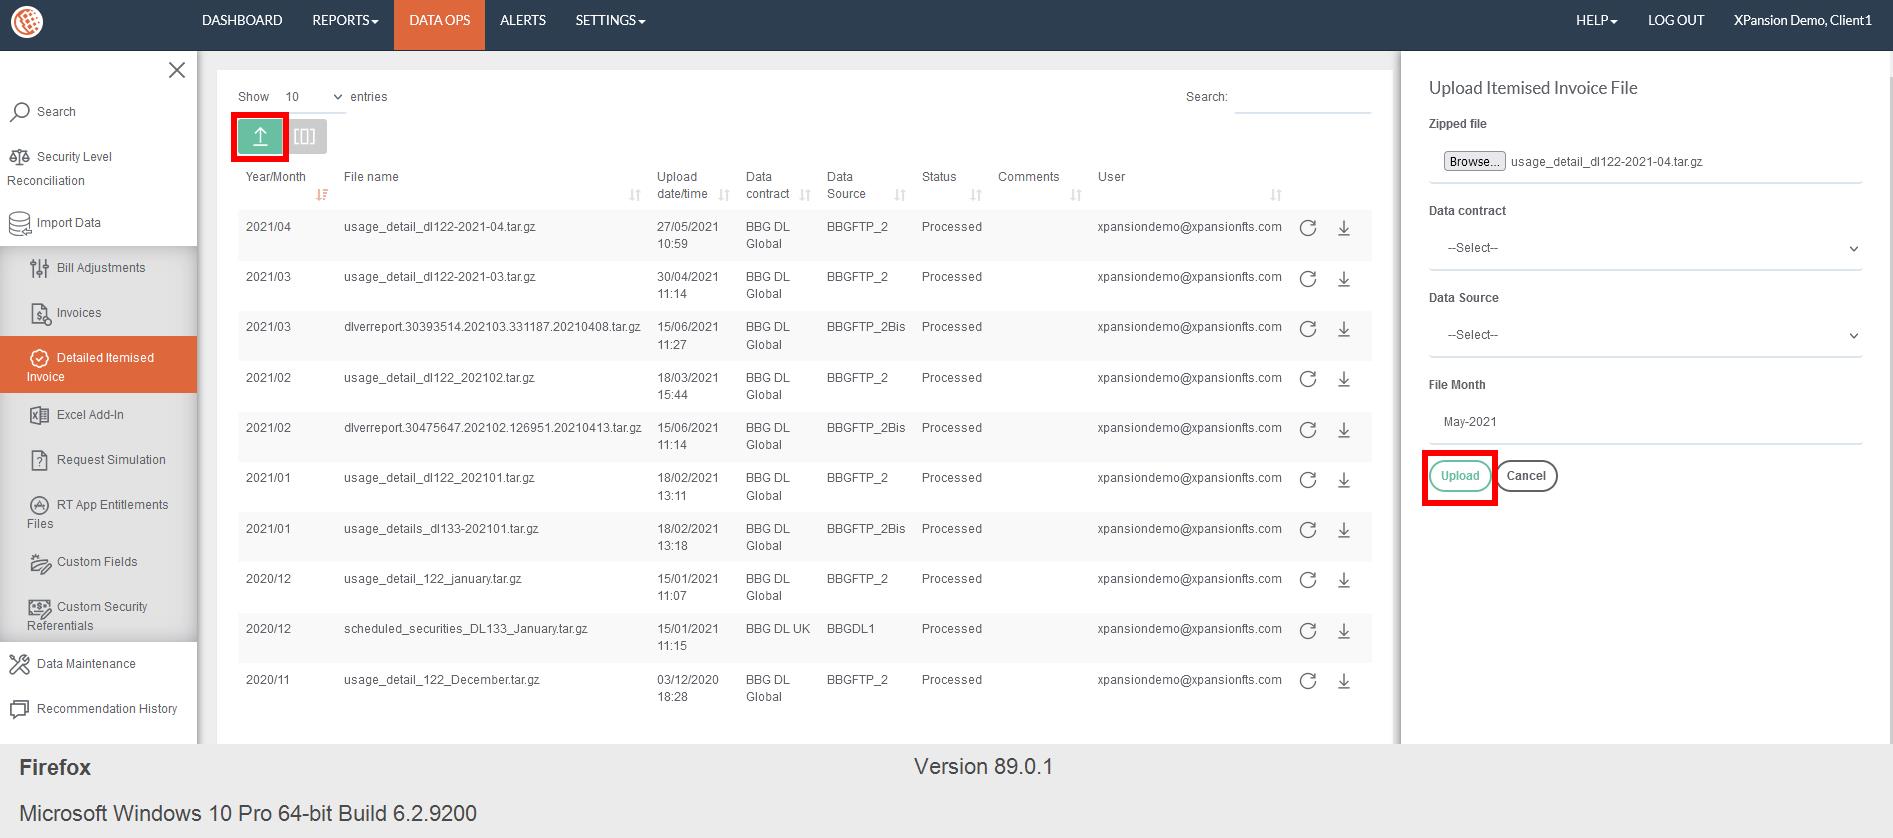
4.3.3How to upload Detailed Itemised Invoice
Vendors provide their end users with a detailed invoice on a monthly basis which contains all the details of the files processed for a given month.
In Xmon, you have the opportunity to upload such files in .tar.gz format which are then processed through an overnight job by comparing the processed file vs the one in Xmon environment. Once the file is uploaded, we are able to identify any exceptions of the files that have not been reconciled in the menu REPORTS > REQUEST FILES RECONCILIATION.
In order to upload the file, you need to follow the below steps:
●Go to the menu ‘DATA OPS’ > ‘Import Data > Detailed itemised invoice.
●Tap on the 
●Select the file you wish to upload, choose the Data Contract associated with this report, the Data Source Name and finally select the month handled by this file. The 'File Month' field should correspond to the relevant activity month of the Detailed Itemised Invoice. You will only be able to upload the Detailed Itemised Invoice each month for a single Data Source. In case of multiple Data Sources you will be able to upload one Detailed Itemised Invoice for each Data Source every month.
●Then click on Upload:
 Replay Detailed itemised invoice > In case the status doesn’t display as Processed
 To download the file
 To delete the file
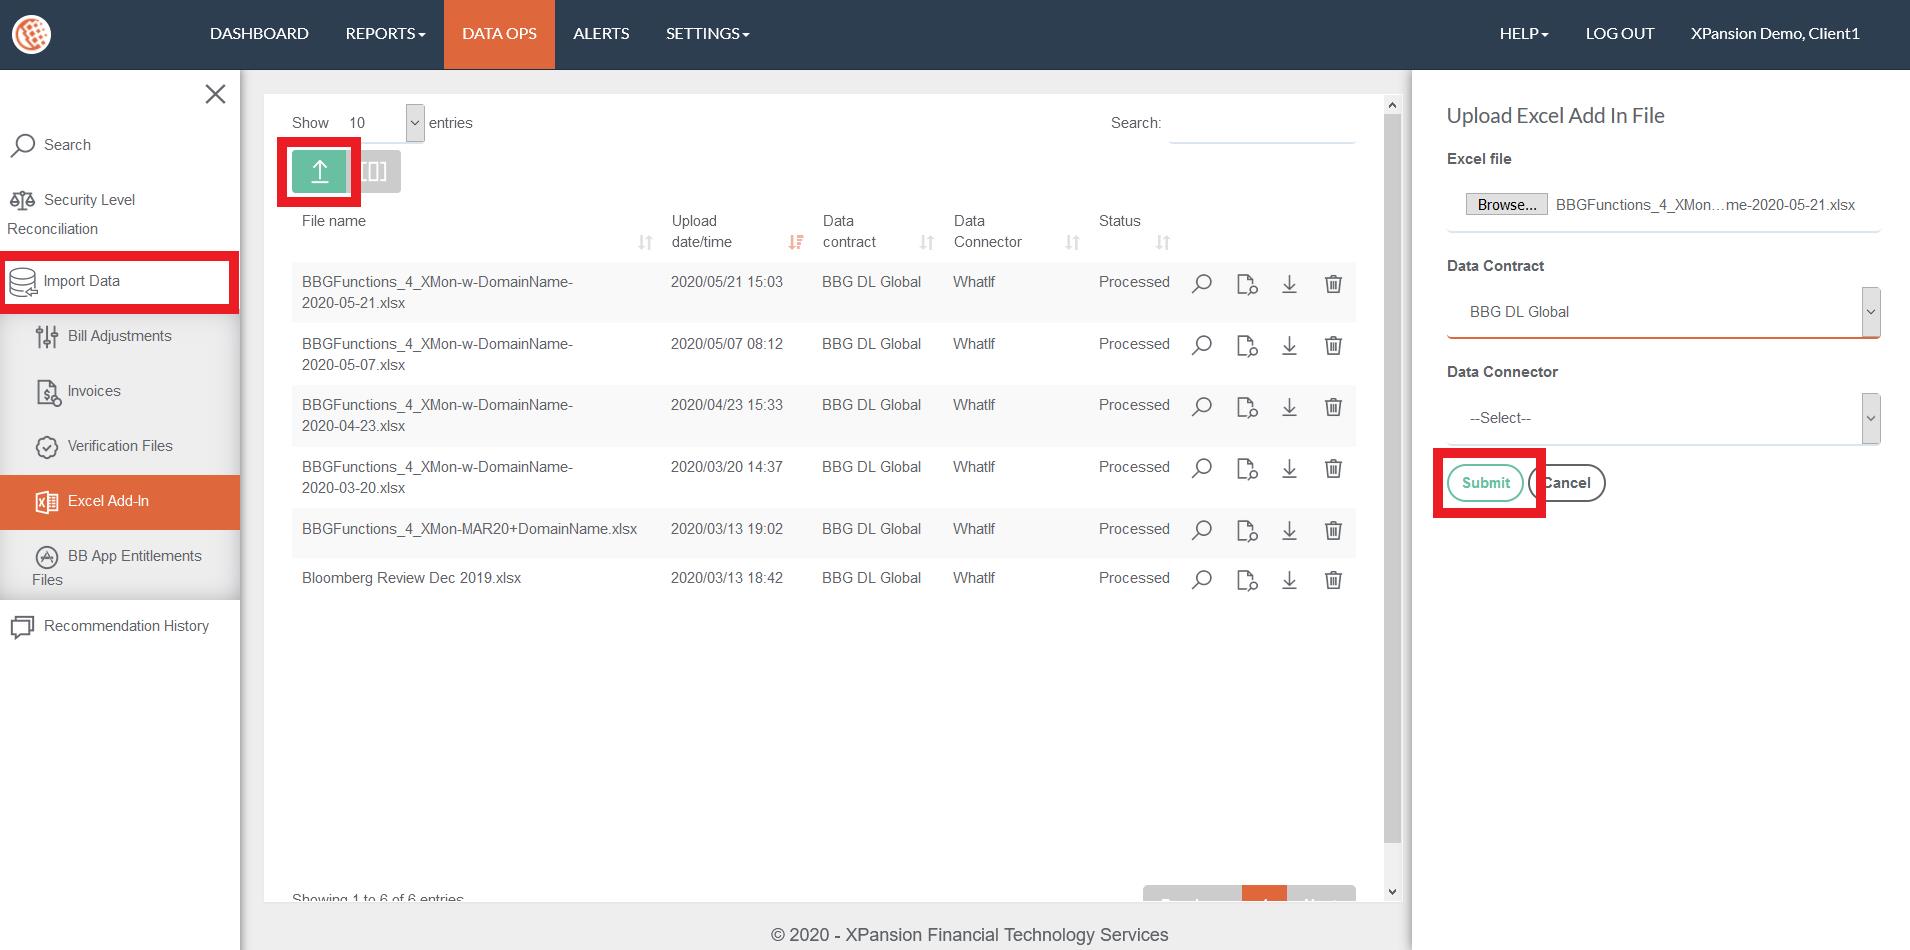
4.3.4How to upload Excel Add-In
This feature has been designed by Xmon exclusively for DDS (Desktop Data Service) users. The user is able to upload the file in .xls format and estimate the cost before running the Excel Add-In. Using this tool will help the client to avoid undesirable costs by showing the costs of the spreadsheet in the form of requests on the dashboard. These requests will be blocked and won’t be sent to Bloomberg. Once the client reviews the costs, he will decide whether he will run the Excel Add-In in the spreadsheet or not.
In order to access the Excel Add-In, you need to go to the menu ‘DATA OPS’ > ‘IMPORT DATA’ > ‘UPLOAD EXCEL ADD-IN’
 Explore requests. Once the user taps this button is automatically navigated to the Requests. More information can be found in Search Requests
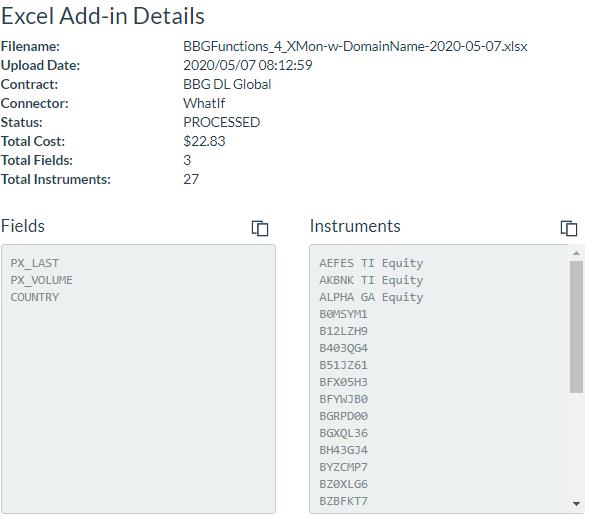
 Excel Add-In Details. Providing details such as the filename, date, contract, connector, status, costs, fields and instruments
 Download the spreadsheet
 Delete the spreadsheet
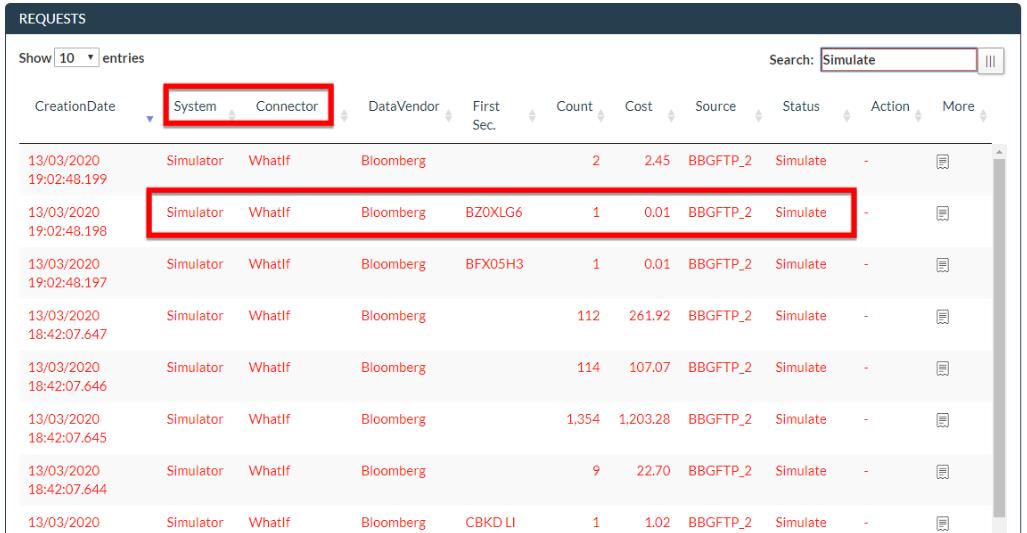
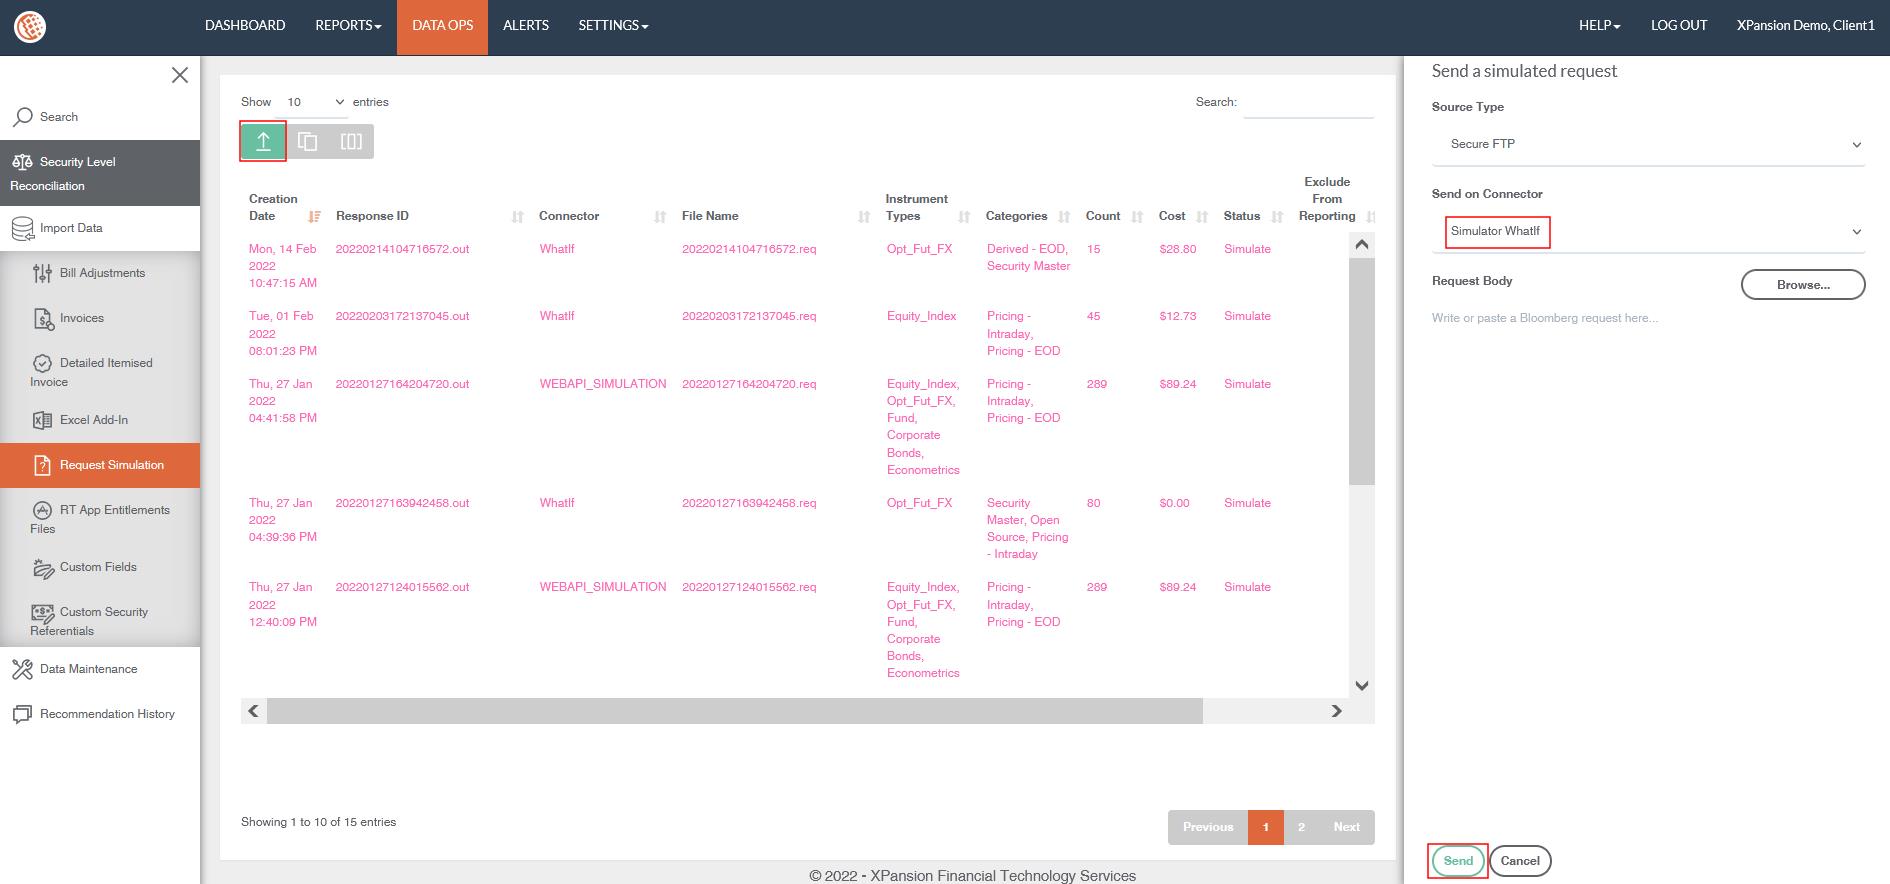
4.3.5How to Simulate a Request
Simulate the cost of a request by clicking on the green arrow, selecting the right Connector and pasting the Request body. Click on Send and the request will be populated with the Status Simulate.
4.3.6How to upload Real-Time BB Entitlements Files for Application
Bloomberg Managed B-Pipe requires definition of permission per exchange to receive Real-time price to each application connected to B-Pipe. Xmon can enrich the REPORTS > SUBSCRIPTIONS table with the application’s Bloomberg Managed B-Pipe Exchange entitlements by doing the following:
●Return the Application BB Entitlements from Bloomberg B-Pipe managed website:
https://service.blpprofessional.com/portal/product/
●Then navigate to Xmon DATA OPS > Import data > BB Apps entitlements
●Click on ‘Upload’ button, browse to the .csv export, select the Real-Time contract and the date the export .csv has been done and click ‘Upload’
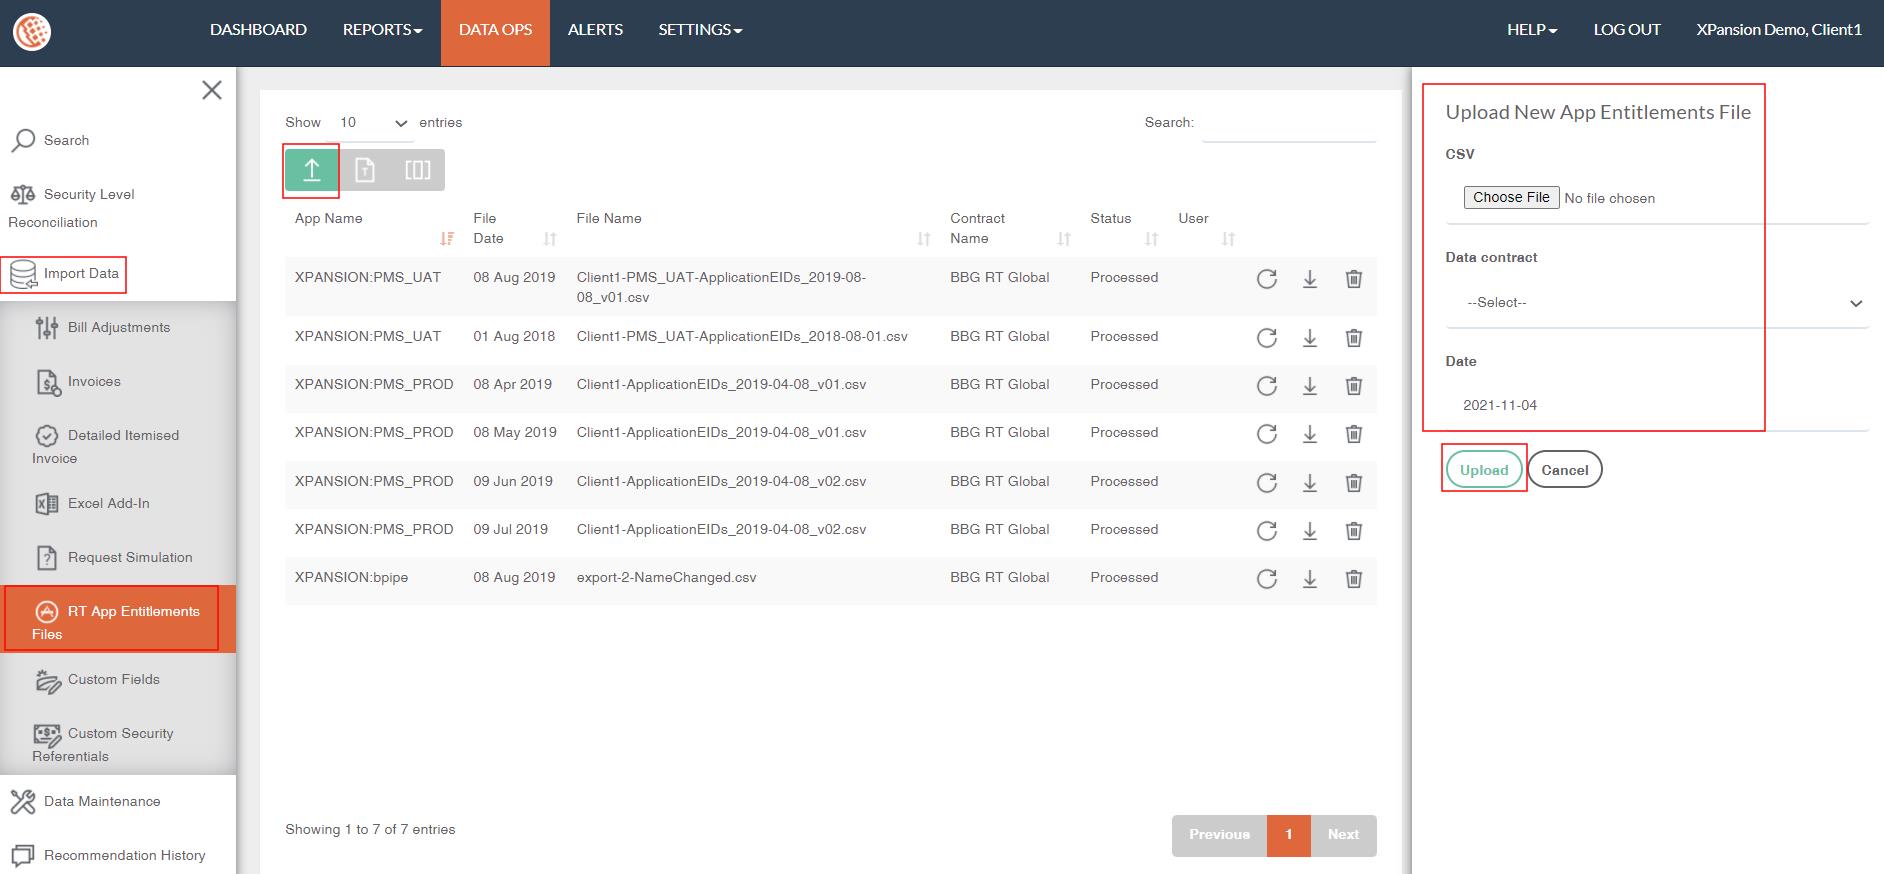
●Once processed in the list, the Application will be created in SETTINGS > End Users automatically if need and REPORTS > SUBSCRIPTIONS menu will be updated with the details of the Real-Time Exchange Entitlements assigned to this application:
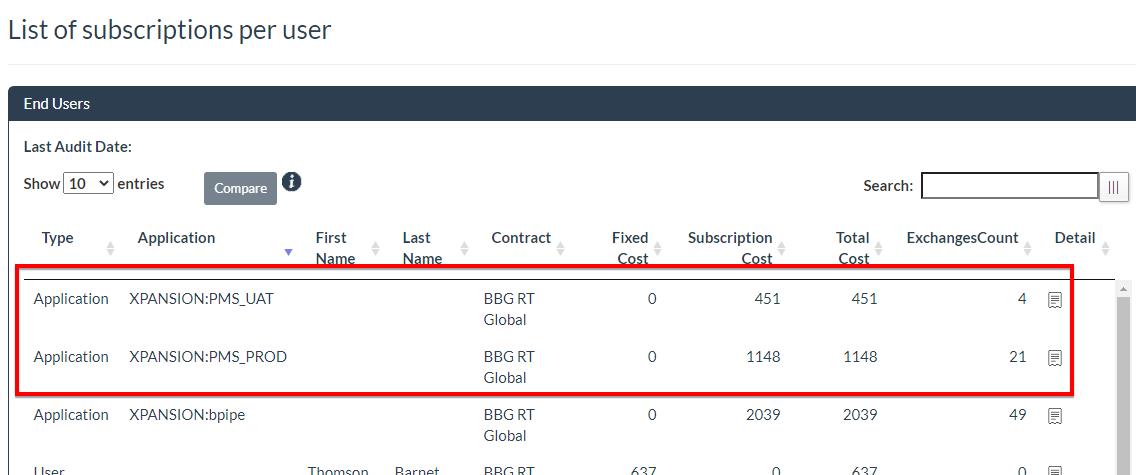
For more details on this report, please refers to the section RT Exchange Subscription Cost Report by End User
4.3.7How to Upload Custom Fields
Xmon has the possibility to enrich the data dictionary of fields with user custom fields and their associated attributes. In order to enrich this dictionary, follow the below steps:
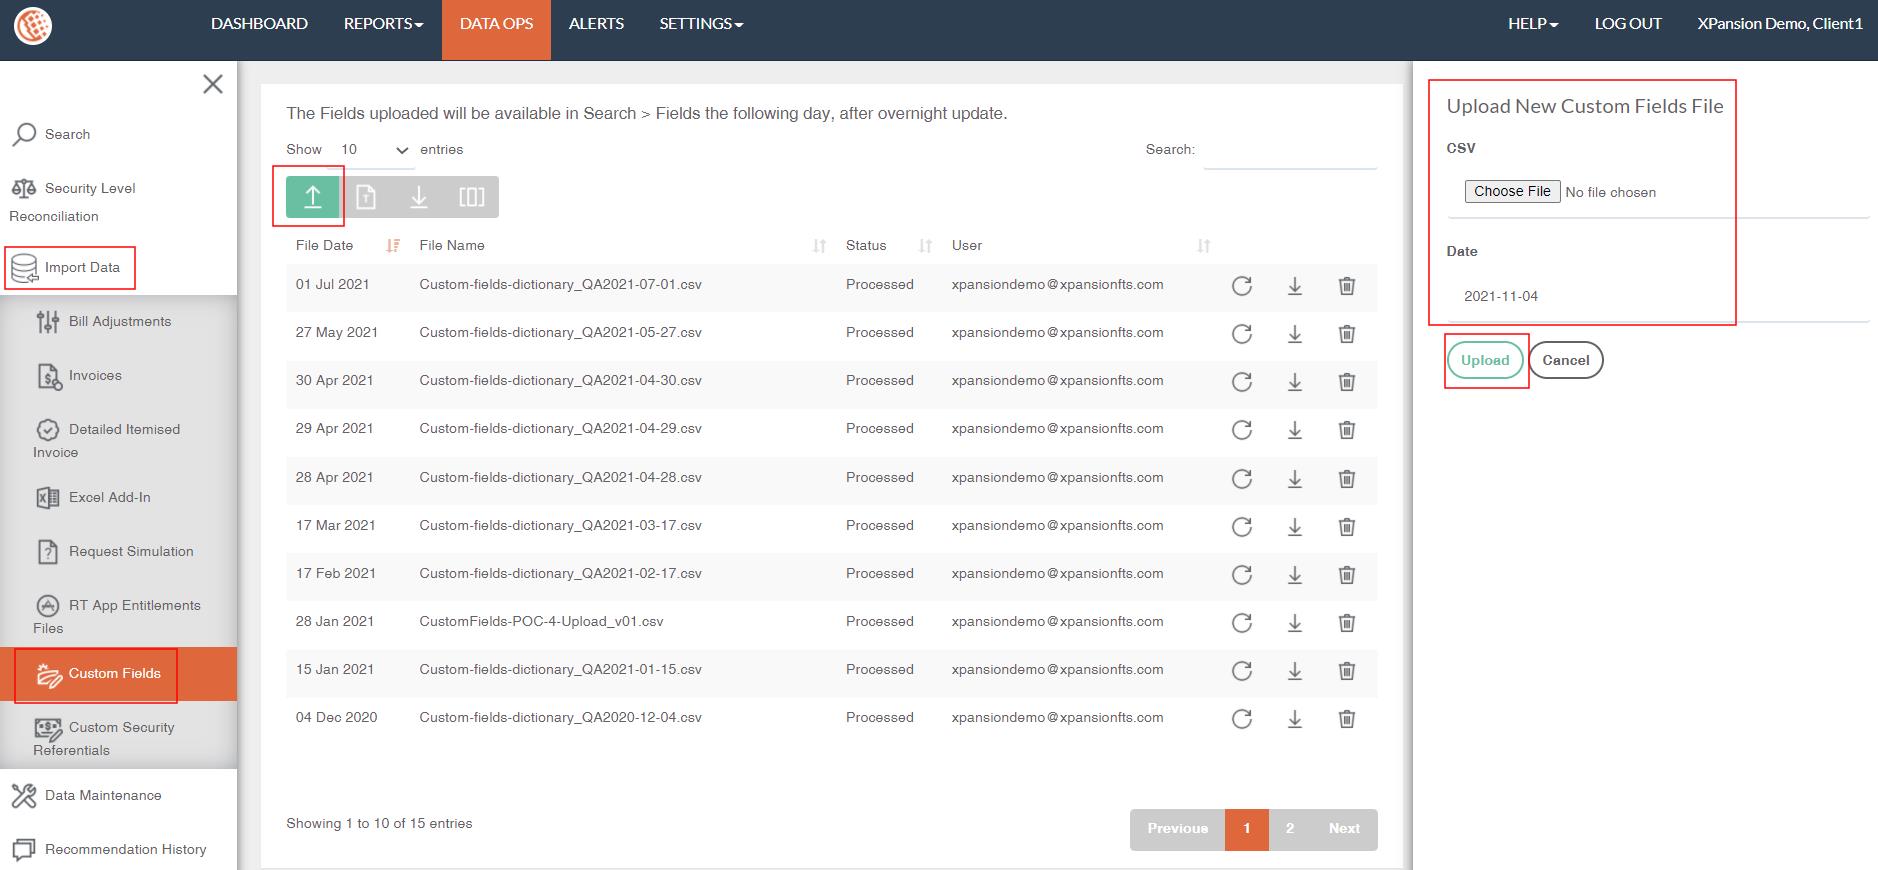
●Navigate to DATA OPS > Import Data > Custom Fields
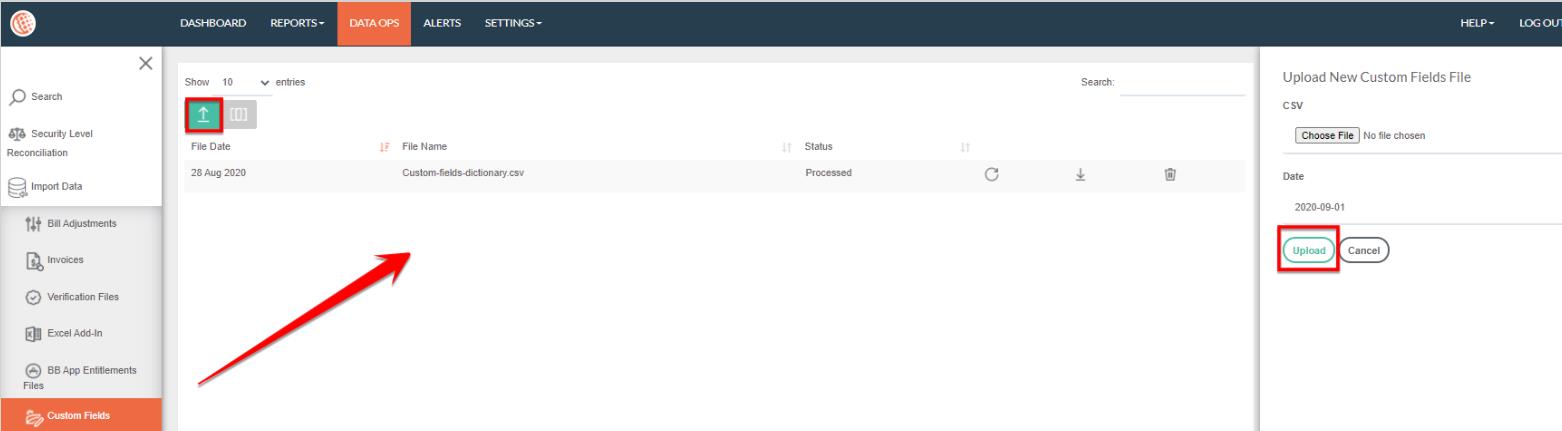
●Click on ‘Upload’ button on top-left of the table, browse to your custom dictionary and select the date and click on ‘Upload’
●Please note that the categories currently supported in the file are:
Categories supporting with Xmon pricing model:
●Basic Tax
●Central Bank Eligibility
●Collateral Tagging
●Corporate Actions
●Covered Funds
●Credit Risk Capital Structure
●Credit Risk Corporate Structure
●Credit Risk Regulatory Compliance
●Default Risk
●Derived - End of Day
●Derived - Intraday
●EnvironmentalSocialAndGovernance
●Estimates
●Expected Credit Loss
●FRTBRFETData
●Fundamentals
●FundamentalsExpanded
●FundamentalsIndustrySpecific
●FundamentalsSegmentation
●High Quality Liquid Assets
●Historical Time Series
●IFRS 9 SPPI
●Investor Protection
●Liquidity Assessment
●MiFIR
●Open Source
●Packaged
●Pricing - End of Day
●Pricing - Intraday
●Reg SSFA
●Security Master
●SecurityOwnership
●SupplyChain
●UK MIFI
●US Withholding Tax
●Volatility Cube
●Volatility Surface
●Once processed the fields will be added to the dictionary of Xmon request processor and they will be understood and associated categories will be recognised and associated pricing will be triggered if applicable.
Note: The fields dictionary lookup feature is available in the menu DATA OPS > Search > Fields. It is updated overnight so new custom fields will only be able to be searched the day following the processing of a new custom fields.
4.3.8How to configure Auto-tagging of requests
This feature is intended to be used in conjunction with the Auto-pilot mode of Xmon where all requests from a given Data Source are retrieved from the SFTP accounts and assigned to a DATA CONNECTOR setup in Purpose = ‘Auto-Pilot’ mode. To set up a Data Connector see How to Configure a Connector?
This feature empowers the user to split the requests retrieved between different Data Connectors (defined in purpose = ‘Active’) so Xmon can compute additional analytics like cost allocation by systems. The association of requests to a given Data connector is defined based on the request filename prefix.
To define an auto-tagging rule:
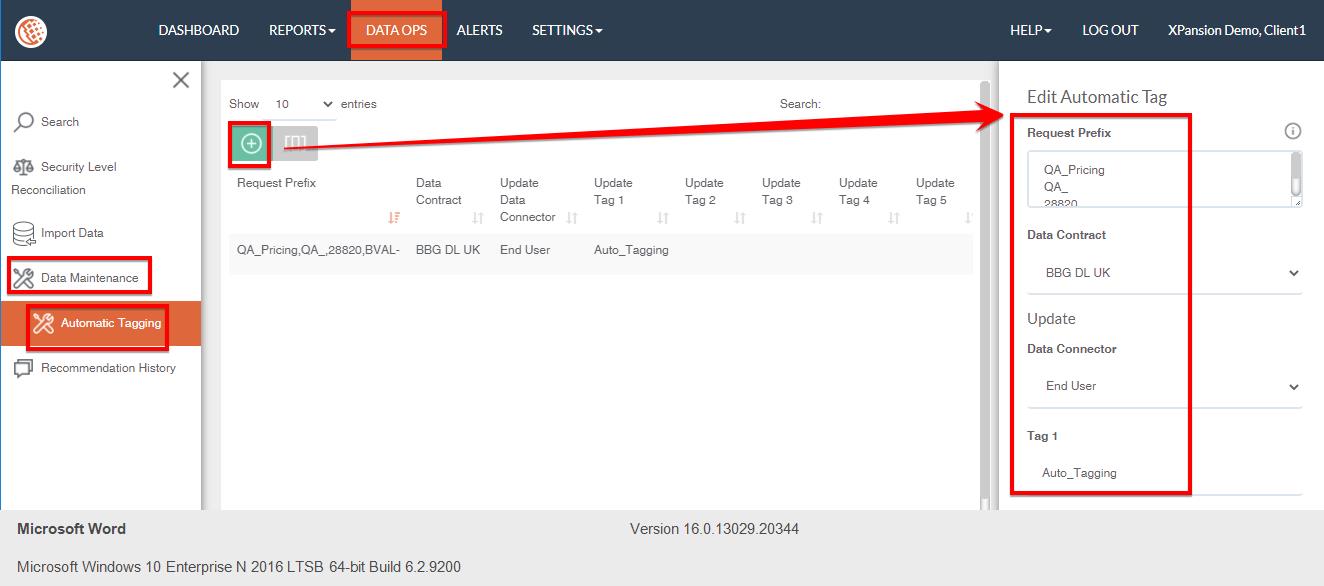
●Navigate to the menu DATA OPS > Data Maintenance > Automatic Tagging
●Click on + button to insert a new rule or ‘Edit’ button at the right side of an existing rule to edit.
●Insert in ‘Request Prefix’ the list of Request filename prefix that should be tagged (separate each prefix with ENTER or ; or | ) and select the Data contract to search those such request file
●Then in the section ‘Update’ define the new ‘Data Connector’ to assign those requests to as well as any tags value. (For more details on tags please refers to section Enrich Requests classifications with Tags)
●Then click ‘Submit’
●Auto-Tagging process is running on the background of Xmon services and runs regularly through the day so that overnight recalculation will take into account the new assignment of requests.
●Results of the auto-tagging can be followed when looking at request level in the DASHBOARD menu or DATA OPS > Search > Requests
4.4Data Maintenance

4.5Recommendation History
This Recommendation history table shows a summary of the recommendations that have been identified by both the end user of Xmon and the Xpansion team when analysing the data download cost profile.
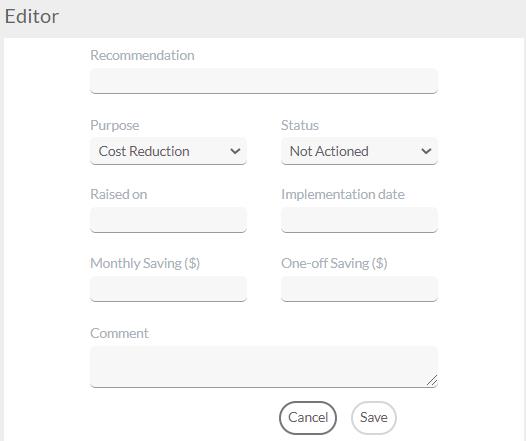
This provides the opportunity to set identified and realized savings in order to reduce future costs. It involves the creation and maintenance of a plan, such as the recommendation, purpose, status and comment. They are all explained by the actions that need to be taken from the client in order to achieve the pre-defined goals for cost reductions. Recommendation History can be found in ‘DATA OPS’ > ‘RECOMMENDATION HISTORY’
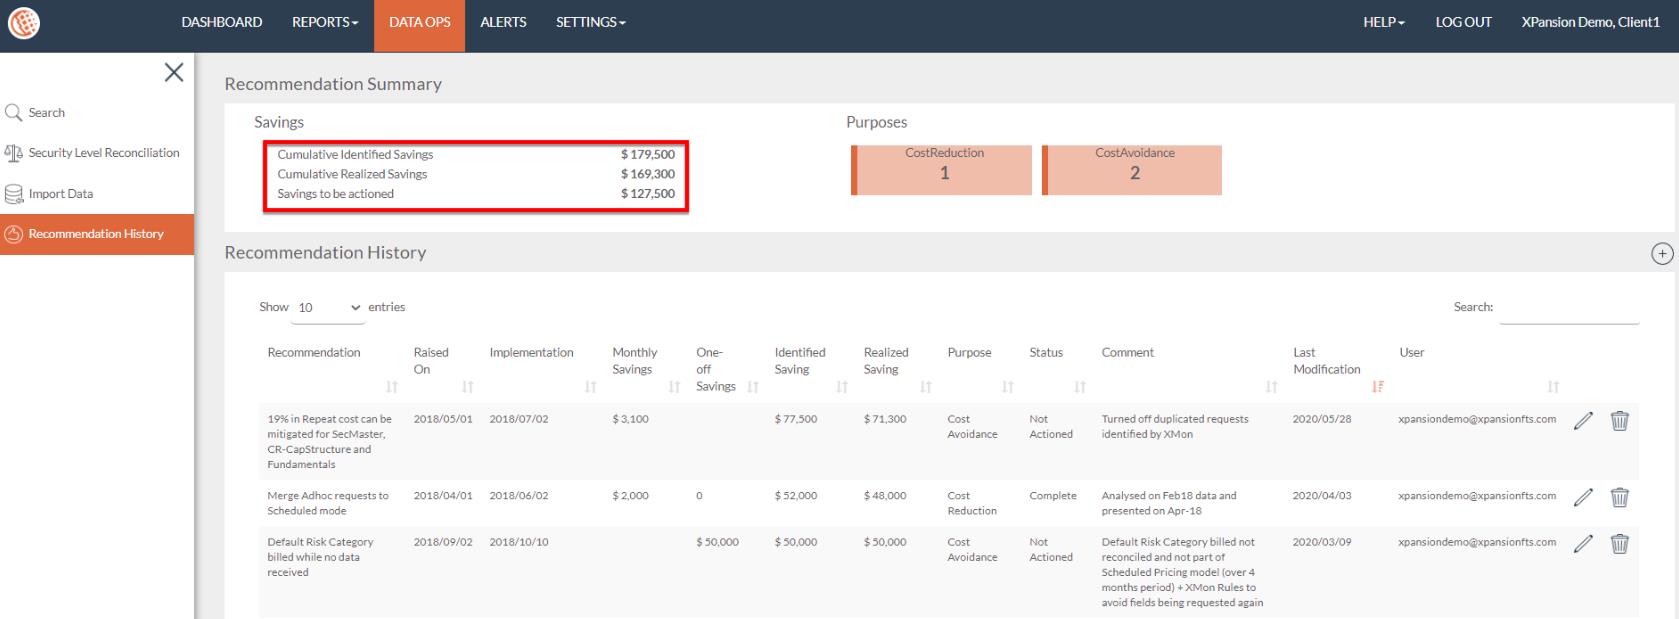
- Raised on: The date whereas the recommendation has been raised
- Implementation Date: The date whereas the recommendation will take action
- Monthly Savings: The monthly cost of the recommendation (Regular savings)
- One-Off Savings: This is one-off saving and doesn’t have any multiplication
- Identified Saving: The monthly cost multiplied by the number of months between the current date and the “Raised on” date + One-off cost
- Realized Saving: The monthly cost multiplied by the number of months between the current date and the “Implementation date” + One-off cost if a task has been implemented.
- Purpose: Cost reduction, Cost avoidance, Compliance and Reference Data Entitlement
- Status: Not Action, In progress and Complete
In order to add a new Recommendation simply tap on the  and the below window editor will be shown:
5 Admin
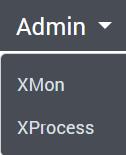
Admin section, which can be selected in the dropdown in the top left corner of the application, serves as a tool to administer Xmon:
In the Account > My Account section, users can configure their main application upon login – Xmon or Xprocess , select their landing page – Dashboard or Data Explorer, register themselves as either Functional or Technical contact and change their password.
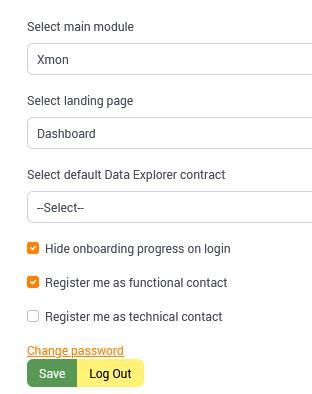
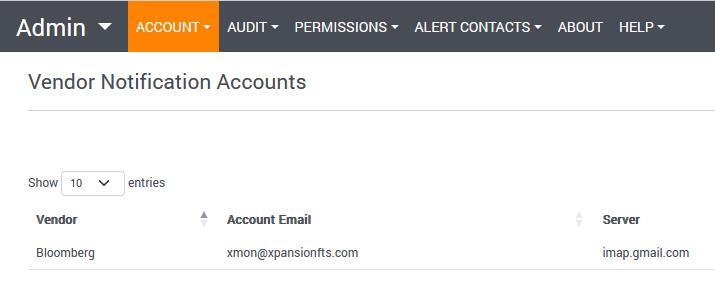
Under Vendor Notifications section of Account, users can set up the e-mail they wish to have vendor notifications sent to.
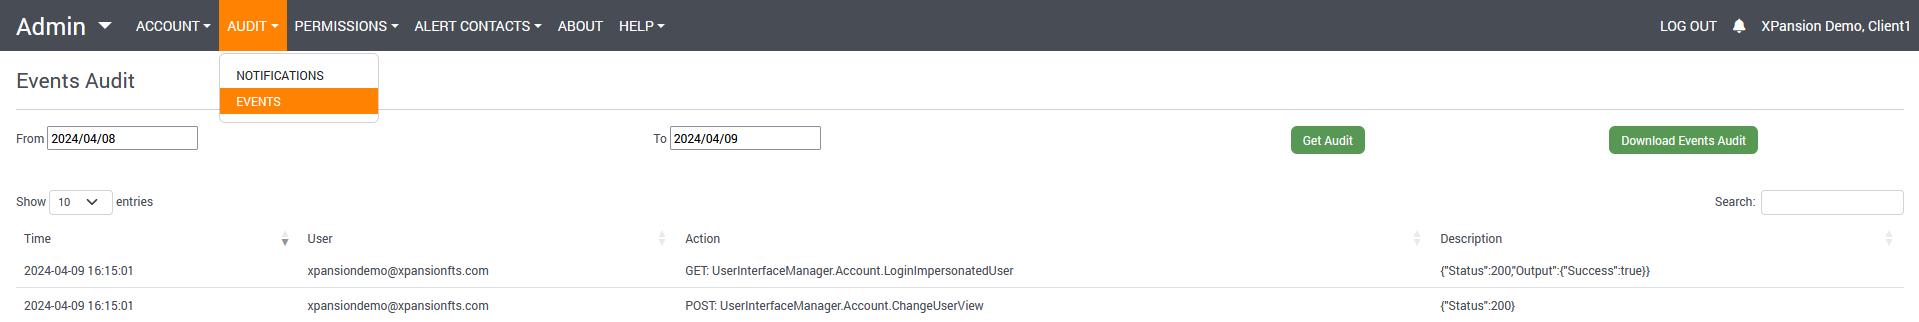
In Audit section, the user can view and download the Audit of Notifications and Events.
In the Permissions section, Administrators can manage data access as well as other users and their privileges in the User Assignment section:
In Alert Contacts, users can be set up in different groups, as needed, to receive e-mail alerts, as well as integrate them with Microsoft Teams:
In the About section, users can e-mail Xmon support directly and download Xpansion Root CA certificate: